
Uploaded by
brody-ayers
2 SLIDES
144 VUES
20LIKES
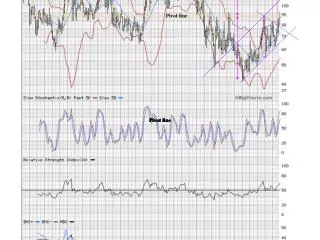
Understanding Pivot Lines: A Key Tool in Trading Analysis
DESCRIPTION
Pivot lines are essential indicators used by traders to identify potential support and resistance levels in financial markets. These horizontal lines are calculated based on the previous day’s high, low, and close prices, creating a framework for evaluating price movements. By utilizing pivot lines, traders can make informed decisions about entry and exit points, enhancing their trading strategies. This guide will explore how to calculate pivot lines, their significance in trading, and tips for effectively incorporating them into your analysis.
Download
1 / 2
Télécharger la présentation 
Understanding Pivot Lines: A Key Tool in Trading Analysis
An Image/Link below is provided (as is) to download presentation
Download Policy: Content on the Website is provided to you AS IS for your information and personal use and may not be sold / licensed / shared on other websites without getting consent from its author.
Content is provided to you AS IS for your information and personal use only.
Download presentation by click this link.
While downloading, if for some reason you are not able to download a presentation, the publisher may have deleted the file from their server.
During download, if you can't get a presentation, the file might be deleted by the publisher.
E N D


More Related