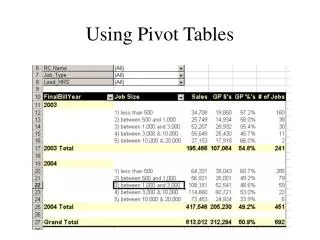
Pivot Tables
Pivot Tables. What is a Pivot Table?. Data analysis function that is part of MS Excel To pivot is to turn the data to view it from different perspectives A very flexible reporting tool A summary of data with quick access to the detail. Why Pivot Tables?. Faster More Efficient


Pivot Tables
E N D
Presentation Transcript
What is a Pivot Table? • Data analysis function that is part of MS Excel • To pivot is to turn the data to view it from different perspectives • A very flexible reporting tool • A summary of data with quick access to the detail
Why Pivot Tables? • Faster • More Efficient • Easy Access to Lots of Data • Flexible • Scalable • People use them!
Gross Profit Table Sales Price Gross Profit $ ActualGross Profit % Est Gross Profit % Est Labor Actual Labor Jan 190,773 99,297 49.07% 52.05% 49,117 62,123 Feb 185,290 79,628 42.83% 50.01% 39,214 64,106 185,290 79628 42.83% 50.01% 39,214 64,106 Mar Apr 185,290 79628 42.83% 50.01% 39,214 64,106 185,290 79628 42.83% 50.01% 39,214 64,106 May
More Info? • What are the Results from HM? • DB? • HM+? • T&M? • How about Last Year? • How about a Breakdown by RC? • By HRS? • How did an HRS do by RC? • Or RC by HRS? • Oh Yeah – Update it each week so we can see trends
What Do We Review with Pivot Tables? • Gross Profit • HRS & RC Performance • Estimates vs. Actual • Marketing Data • Leads, Sales & Closing Ratio by Lead source • Leads, Sales & Closing Ratio by Zip • Unlimited Combinations of the Above • Tracking Warranties
Action’sDefinition of a Successful Business… A Commercial, Profitable, Enterprise - that works - without Me (The Owner)!
5 The Five Proven Ways to Increase Your Business Profits ... Business Chassis Basics Number of Leads x Conversion Rate = Customers x # of Transactions x Avg. $$$ Sale = Revenue x Profit Margins = $Profit$
With just a 10% increase ... Number of Leads x Conversion Rate = Customers x # of Transactions x Avg. $$$ Sale = Revenue x Profit Margins = Profits 4,000 x 25% = 1,000 x 2 x $100 = $200,000 x 25% = $50,000 4,400 x 27.5% = 1,210 x 2.2 x $110 = $292,820 x 27.5% = $80,525.50
That’s a 46% increase in our revenue ... And a massive 61% increase in your profits ...
Growing a $1M Business to a $3M Business ... +3% +3% +3% +3% +3% +6% +6% +6% +6% +6% +9% +9% +9% +9% +9% +12% +12% +12% +12% +12% Q4’2004 375 x 40.0% = 150 x 1.00 x $1,600 = $240,000 x 20.0% = $48,000 $960,000 Q1’2005 386 x 41.2% = 159 x 1.03 x $1,648 = $270,122 x 20.6% = $55,645 $270,122 $1,080,448 Q2’2005 409 x 43.7% = 179 x 1.09 x $1,747 = $341,023 x 21.8% = $74,466 $611,245 $1,080,448 Q3’2005 446 x 48.0% = 212 x 1.19 x $1,904 = $481,382 x 23.8% = $114,575 $1,092,527 $1,925,527 Q4’2005 500 x 53.0% = 266 x 1.33 x $2,133 = $757,463 x 26.7% = $201,920 $1,849,990 $3,029,854 Number of Leads x Conversion Rate = Customers x # of Transactions x Avg. $$$ Sale = Revenue x Profit Margins = <> Profits <> YTD Revenue: Annual Run Rate:
5 The Five Proven Ways to Increase Your Business Profits ... #5 #2 #4 #3 #1 Number of Leads x Conversion Rate = Customers x # of Transactions x Avg. $$$ Sale = Revenue x Profit Margins = $Profit$