Pivot tables and charts
230 likes | 488 Vues
CS1100 Computer Science and its Applications. Pivot tables and charts. What is a pivot table?. A special kind of table that summarizes information from selected fields of a data source. Is linked to the data from which its derived

Pivot tables and charts
E N D
Presentation Transcript
CS1100 Computer Science and its Applications Pivot tables and charts Pivot tables and charts
What is a pivot table? • A special kind of table that summarizes information from selected fields of a data source. • Is linked to the data from which its derived • Data can be from an Excel sheet, or external such as from a database file • Access tables can be easily imported to Excel to create pivot tables Pivot tables and charts
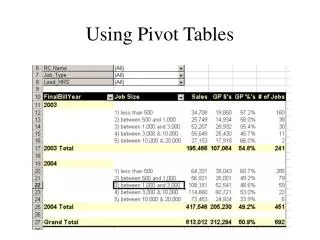
It’s difficult to see the bottom line in a flat list like this, turning the list into a Pivot Table will help. Pivot tables and charts
Examples • Summarizing data, i.e. finding average sales for each region for each product • Filtering, sorting, summarizing data without writing any formulas • Transposing data • Linking data sources Pivot tables and charts
Pivot Table Setup • To create a pivot table, specify: • Which fields you’re interested in • How you want the table organized • What kinds of calculations you want to perform • You can: • Rearrange it to view from alternative perspectives • “pivot” the dimensions – i.e. transpose column headings to row positions Pivot tables and charts
Creating a Pivot table or chart • Step 1: Select the datarange from which you want to make the pivot table. • Step 2: Go to Insert tab and click on new Pivot table option • select PivotTable or PivotChart option. • Step 3: Excel will display a Pivot table wizard where you can specify the pivot table target location etc. Select “New worksheet” option and your pivot table will be placed in new worksheet. Pivot tables and charts
Creating a Pivot table • Step 4: Make your first Pivot Table • The PivotTable Field list is divided into sections. • You can drag and drop the fields you want in each area. • The body of the table will contain three parts: Rows, Columns and Cells. You can use any fields in these areas. Pivot tables and charts
You can add subtotals, from the Design Tab under PivotTable Tools. Click the down arrow to change field settings and formatting Pivot tables and charts
Same data, different story • The data is the same, only the perspective is different Pivot tables and charts
Add a Filter Pivot tables and charts
Slicers • It is not easy to see the current filtering state when you filter on multiple items • Slicers are easy-to-use filtering components with buttons that enable you to quickly filter the data in a PivotTable, without opening drop-down lists to find the items that you want to filter. • In addition to quick filtering, slicers also indicate the current filtering state, which makes it easy to understand what exactly is shown in a filtered PivotTable report. Pivot tables and charts
Slicers • Slicers allow us to quickly filter the table to show only the North region and the RapidZoo product for all Salesmen Pivot tables and charts
Multiple Summary Functionsto the Same Field Drag another copy of the field into the Values box. Pivot Tables and Charts
Calculated Fields • In a pivot table, you can create a new field that performs a calculation on the sum of other pivot fields. For example, we can create a calculated field named Bonus to calculate 3% of the Total Net Sales as a bonus for each salesperson. Pivot tables and charts
Calculate a Bonus for each Salesperson Pivot tables and charts
About Calculated Fields • For calculated fields, the individual amounts in the other fields are summed, and then the calculation is performed on the total amount. • Calculated field formulas cannot refer to the Pivot table totals or subtotals • Calculated field formulas cannot refer to worksheet cells by address or by name. • Sum is the only function available for a calculated field. Pivot tables and charts
To add a calculated field: • Select a cell in the pivot table, and on the Excel Ribbon, under the PivotTable Tools tab, click the Options tab. • In the Calculations group, click Fields, Items & Sets, and then click Calculated Field. • Type a name for the calculated field, for example, Bonus. • In the Formula box, type in the formula • Click Add to save the calculated field, and click Close. The Bonus field appears in the Values area of the pivot table, and in the field list in the PivotTable Field List. Pivot tables and charts
Calculated Items • A calculated item is a new item in an existing field • Derived from calculations performed on other items already in the field. • Example: the service plan for FastCar adds 5% to sales for the product. Create a new Calculated Item that calculates values for FastCar service plans. Pivot tables and charts
Create a Pivot Chart from an Access Table From the Data Menu, choose “From Access” Find your Access file and choose the table or query to use in your pivot table. Pivot tables and charts
Any Questions? Pivot tables and charts