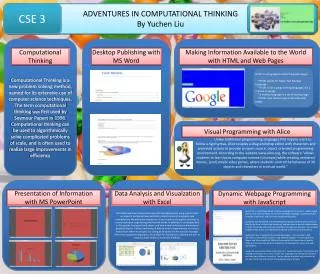
Enhancing Technology Skills: A Tour through CSE3
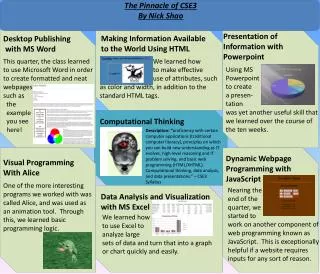
In CSE3, we developed vital skills to enhance our IT fluency, focusing on tools like HTML, JavaScript, Microsoft Excel, Word, and PowerPoint. We conducted data analysis and visualization using Excel, created interactive webpages with JavaScript, and engaged in dynamic presentations with PowerPoint. Through creative projects in ALICE, we built animations that reinforced programming concepts. We also explored career aspirations through desktop publishing in Word, emphasizing the practical applications of these skills in our future careers.

Enhancing Technology Skills: A Tour through CSE3
E N D
Presentation Transcript
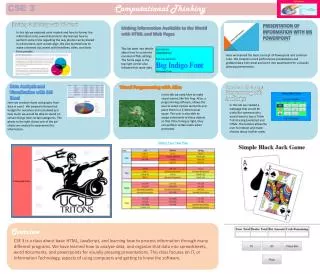
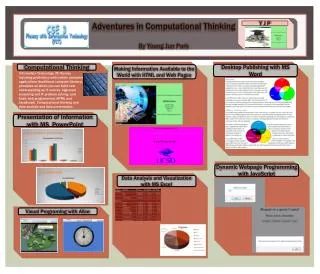
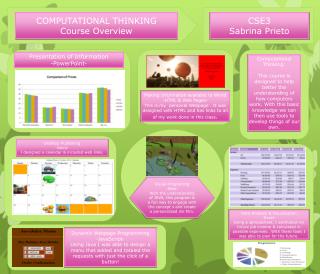
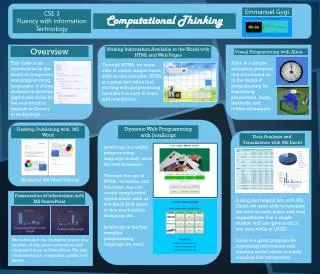
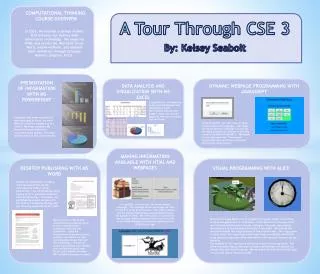
COMPUTATIONAL THINKING: COURSE OVERVIEW A Tour Through CSE 3 In CSE3, we learned a variety of skills that enhance our fluency with information technology. We explored HTML and JavaScript, Microsoft Excel, Word, and PowerPoint, and learned basic animation through Carnegie Mellon’s program, ALICE. By: Kelsey Seabolt PRESENTATION OF INFORMATION WITH MS POWERPOINT DATA ANALYSIS AND VISUALIZATION WITH MS EXCEL DYNAMIC WEBPAGE PROGRAMMING WITH JAVASCRIPT Using MS Excel, we were able to plot and manipulate data pertaining to stock performance and personal budget. Then, we created graphs to represent the data that we found. Using the data that we gathered and organized in Excel, we were able to create bar graphs and pie charts. We then created a MS PowerPoint presentation to represent these graphs. This skill will be useful in the career world! Using JavaScript, we were able to create several interactive webpages. The image shown above was a webpage in which we surveyed students on whether or not they went to Sun God Festival 2013. The image to the right shows the “TritonJuice” virtual juice shop where we computed drink prices using buttons. MAKING INFORMATION AVAILABLE WITH HTML AND WEBPAGES DESKTOP PUBLISHING WITH MS WORD VISUAL PROGRAMMING WITH ALICE One of our tasks was to create a word document that would represent our future career aspirations. I am a Psychology major hoping to go to graduate school for Clinical Psychology. Therefore, my published document pertained to the field of Clinical Psychology and the resulting potential career paths. Using HTML, we were able to create several webpages. The webpage shown above was our task for the first week of the quarter. This HTML creation lists my educational background and objectives for the quarter in CSE3. The HTML product shown below was an extra credit assignment that contained a link to the UCSD webpage, activated by clicking on the UCSD Tritons logo. We used Carnegie Mellon’s free animation program, ALICE, to practice loops and segmentation in animation. In the graphic on the upper left, we created a movie in which frogs, sitting on lilly pads, were nearly attacked by a bird but jumped to safety in the pond. We altered the movie to include five frogs (instead of the original two). The frogs spoke to each other, the camera panned to each frog accordingly, and all five frogs jumped in separate directions when it was time for them to escape the bird. The graphic on the right was a movie we made of a moving clock. The clock animation was an exercise in using counted loops for second (s), minute (m), and hour (h) hands. We were able to make the virtual clock run just the way a real one would! We looked at a website that detailed the two different kinds of color representation techniques: additive and subtractive. Using the information and graphics on the website, we created our own word documents that mirrored the information. In both the career task and the color models task, we learned about page layout and transition between PDF and Word Document formats.