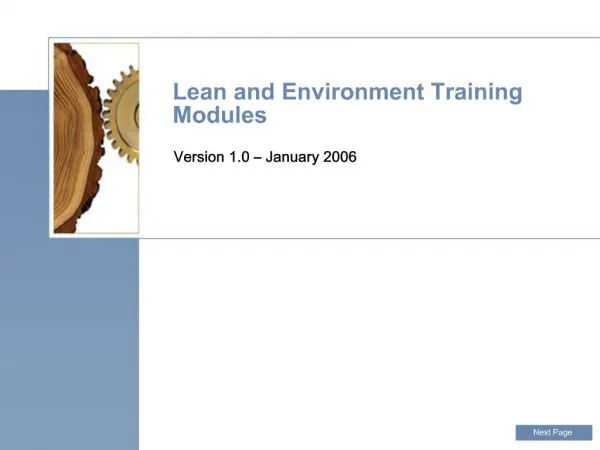
Lean and Environment Training Modules
Lean and Environment Training Modules. Version 1.0 – January 2006. Next Page. Lean and Environment Training Module 3. Value Stream Mapping. Next Page. Previous Page. Next Page. Previous Page. Purpose of This Module.

Lean and Environment Training Modules
E N D
Presentation Transcript
Lean and Environment Training Modules Version 1.0 – January 2006 Next Page
Lean and Environment Training Module 3 Value Stream Mapping Next Page Previous Page
Next Page Previous Page Purpose of This Module • “Learn to see” environmental wasteand material efficiency opportunities in value stream maps (VSMs) • Identify new opportunities to improve operational and environmental results • Know when to draw on environmental expertise in Lean events to best achieve the desired future state More on Environmental Waste
What is Value Stream Mapping? • Value stream mapping is a process-mapping method that enables your organization to: • Current State Map: Visual representation of existing operations (information and product flows) • Identify the largest sources of waste (non-value added activity) in the value stream • Future State Map: Drawing of Lean flow (vision) • Develop implementation plan for Lean activities Next Page More on VSM Previous Page
Map the Process • Makes work visible • Visibility improves communication and understanding • Identifies Improvement Opportunities • Eliminate the non-value added steps • Reduce wasted resources • Diagnostics • Determine the cause of a problem or condition. • Training and communication
Production Control Market Forecast Weekly delivery schedule Annual Production Plan Customer A Customer B D Supplier 1 Supplier 2 Daily schedule D Weekly schedule WK WK I Daily schedule Daily schedule 30 days Shipping Receiving I Assembly & Inspection Welding Painting Milling I I I 5 days 2 people 3 people 3 people 2 people C/T = 2 min C/O = 2 hr Uptime = 74% C/T = 4 min C/O = 3 hr Uptime = 61% C/T = 2 min C/O = 30 min Uptime = 93% C/T = 7 min C/O = 4 hr Uptime = 48% 5 days 10 days 15 days 8 days 30 days 2 min 4 min 7 min 2 min Total Lead Time = 68 days Value Added Time = 15 min Next Page Previous Page Current State Value Stream Map (Unmodified) Key to VSM Symbols
Next Page Previous Page Opportunities to Enhance Value Stream Mapping • Classic Value stream mapping can overlook environmental considerations: • Raw materials used vs. needed in products and processes • Pollution & other environmental wastes in the value stream • Flows of information to environmental regulatory agencies • Making some simple adjustments to your value stream map can help you explicitly address pollution and natural resource wastes: • Improving cost reduction opportunities • Saving additional time • Improving the health and safety of the workplace
Next Page Previous Page Overview of Value Stream Mapping Tools in this Training Module • A variety of tools & techniques can enhance the Lean and environmental results of value stream mapping • Use icons to identify processes with EHS opportunities • Record environmental data for processes in VSMs • Analyze materials use vs. need in a “materials line” for VSMs • Expand the application of value stream mapping to natural resource flows • Find Lean and environment opportunities in future state VSMs
Next Page Previous Page 1. Use Icons to Identify Processes with EHS Opportunities • Use icons or red dots to identify processes with key environmental, health, and safety (EHS) opportunities on value stream maps • Icons can also highlight where EHS staff expertise will likely be needed EHS Milling 2 people Process Box with EHS Icon
Production Control Market Forecast Weekly delivery schedule Annual Production Plan Customer A Customer B D Supplier 1 Supplier 2 Daily schedule D Weekly schedule WK WK I Daily schedule Daily schedule 30 days Shipping EHS EHS EHS Receiving I Assembly & Inspection Welding Painting Milling I I I 5 days 2 people 3 people 3 people 2 people C/T = 2 min C/O = 2 hr Uptime = 74% C/T = 4 min C/O = 3 hr Uptime = 61% C/T = 2 min C/O = 30 min Uptime = 93% C/T = 7 min C/O = 4 hr Uptime = 48% 5 days 10 days 15 days 8 days 30 days 2 min 4 min 7 min 2 min Total Lead Time = 68 days Value Added Time = 15 min Next Page Previous Page VSM with EHS Process Icons
Next Page Previous Page Where to Put Environmental Icons on VSMs? • Assess each process for environmental wastes and EHS improvement opportunities • Look for processes… • with high energy, water, and material use • with significant solid or hazardous waste generation • requiring environmental permits or reporting to environmental agencies • with pollution control equipment • using toxic chemicals that require personal protective equipment (PPE)
Next Page Previous Page EHS Staff Can Help • Involve EHS staff when developing VSMs – they can help identify where EHS icons are most needed • EHS staff involvement from start to finish is optimal • EHS staff involvement on a consultative basis can also be an effective option • Build on previous environmental assessment work • If your organization has an Environmental Management System (EMS), EHS staff should have info on processes’ environmental impacts
Metal casting Chemical and heat treatment of materials Metal fabrication and machining Cleaning and surface preparation Bonding and sealing Welding Metal finishing and plating Painting and coating Waste management Chemical and hazardous materials management Next Page Previous Page Common Processes with EHS Wastes and Opportunities Click here to learn about pollution prevention resources that could apply to these processes P2 Resources
Next Page Previous Page 2. Record Environmental Data for Processes in VSMs • Start by identifying 1 or 2 environmental performance metrics to add to process boxes in VSMs, and consider adding more if appropriate More Info on Metrics
Next Page Previous Page Adding Environmental Data to VSMs • Add key environmental data to process boxes on value stream maps EHS Milling 2 people C/T = 2 min C/O = 2 hr Uptime = 74% Haz. Waste = 5 lbs Hazardous waste generated per shift
Production Control Market Forecast Annual Production Plan Customer A Customer B Weekly delivery schedule Supplier 1 Supplier 2 D Daily schedule Weekly schedule I Daily schedule D Daily schedule WK WK 30 days Shipping EHS EHS EHS Receiving I Assembly & Inspection Welding Painting Milling I I I 5 days 2 people 3 people 3 people 2 people C/T = 2 min C/O = 2 hr Uptime = 74% Haz. Waste = 5 lbs C/T = 4 min C/O = 3 hr Uptime = 61% Haz. Waste = 20 lbs C/T = 2 min C/O = 30 min Uptime = 93% C/T = 7 min C/O = 4 hr Uptime = 48% Haz. Waste = 60 lbs 5 days 10 days 15 days 8 days 30 days 2 min 4 min 7 min 2 min Total Lead Time = 68 days Value Added Time = 15 min VSM with Environmental Metrics & EHS Icons
Next Page Previous Page How Can Materials Lines Be Useful? • Identify and quantify the materials used and lost in a process or a facility. • Provides concise picture of: • all materials used in facility • how each material is received, handled, stored, used, reused, and lost • Materials in = Materials out + Materials Accumulated Important Considerations
5 days 10 days Lead Time = 15 days Value Added Time = 6 min 2 min 4 min Analyze Materials Use Versus Need in a “Materials Line” • The “timeline” on value stream maps looks at value-added and non-value-added time in the value stream • Add a “materials line” to examine: • Amount of raw materials used by each process • Amount of materials that end up in the product and add value from the customer’s perspective
Next Page Previous Page Example Materials Line • Materials lines can be developed for any major material source used in processes and products EHS EHS Welding Milling I I 2 people 2 people 120 lbs 15 lbs Materials Used = 135 lbs Materials Needed = 85 lbs Materials Wasted = 50 lbs 80 lbs 5 lbs Top line: Materials Used by Process Bottom line: Materials Added to Product During the Process
Production Control Market Forecast Annual Production Plan Customer A Customer B Weekly delivery schedule Supplier 1 Supplier 2 D Daily schedule Weekly schedule I Daily schedule Daily schedule D WK WK 30 days Shipping EHS EHS EHS Receiving I Assembly & Inspection Welding Painting Milling I I I 5 days 2 people 3 people 3 people 2 people C/T = 2 min C/O = 2 hr Uptime = 74% C/T = 4 min C/O = 3 hr Uptime = 61% C/T = 2 min C/O = 30 min Uptime = 93% C/T = 7 min C/O = 4 hr Uptime = 48% 5 days 10 days 15 days 8 days 30 days 2 min 4 min 7 min 2 min 20 lbs 120 lbs 15 lbs 40 lbs 80 lbs 5 lbs 20 lbs 5 lbs Total Lead Time = 68 days Value Added Time = 15 min Total Materials Used = 195 lbs Materials Needed = 110 lbs VSM with Materials Line and EHS Icons
Next Page Previous Page TO CONSIDER • Which environmental metric(s) would you choose to include in value stream maps at your company? • Does your company have environmental goals and targets that could be put on value stream maps? • What processes at your company might have the best opportunities for environmental improvement? Previous Page
Next Page Previous Page 4. Expand the Application of Value Stream Mapping to Natural Resource Flows • You can also use VSMs to look in more detail at the inputs, outputs, and information flows associated with the use of energy, water, and/or materials • Energy/water/materials used vs. needed (as with the “materials line” VSM tool) • Environmental waste streams (air emissions, wastewater, hazardous waste, solid waste) • Information flows to environmental regulatory agencies (e.g., reporting air emissions)
EPA Regulations Effluent Federal State Water Source 1 Water Source 2 Source Local Subassembly Molding I Sterilizer Extrusion Filling 1,500K GPD Sterilization Extrusion Molding Subassembly Filling Packing 0 gal 50K gal 45K gal 5K gal 150K gal 50K gal 0 gal 30K gal 35K gal 5K gal 60K gal 45K gal Total H2O Usage = 300K Gallons Per Day Total Need = 175K Gallons Per Day Next Page Previous Page Water Use VSM
Next Page Previous Page Example VSM for Water Use • This VSM examines water use in the value stream of a product that contains water (e.g., a medical IV bag) • It includes: • Water use “materials line” summarizing water usage and need for the value stream • Flows of wastewater from processes to the sewer, water treatment tanks, etc. • Information flows to regulatory agencies regarding water use and wastewater discharges
Sewage Pollution control Regulations 201K gal Into Effluent tank per day Raw water Source Pump No.1 or 2 Local 58K gal 293K gal Multigrade filter RO1 Reject Wash rooms,pantry,Cooling Distillation reject Softener Boiler reject RO2 Reject Boiler feed. Uses 33K gal & rejects all. 58KL Sterilizer reject Multigrade filter Softener RO1 RO2 Still Sterilizer uses and rejects 12K gal H2O: 12Kgal reject H2O: 44Kgal reject H2O: 40Kgal reject 25Kgal overflows & 25Kgal is reject H2O: 10Kgal reject 293Kgal 281Kgal 179Kgal 139Kgal 94Kgal 44Kgal 12Kgal 44Kgal 40Kgal 45Kgal 50Kgal 10Kgal Initial Usage (Gal/day) = 300K gal Per Day Product Need Per Day = 34K gal Per Day Plant Process Initial State 34Kgal
Ongoing Sewage Pollution control Regulations 121K gal Into Effluent tank per day Raw water Source Pump No.1 or 2 Local 58K gal 213K gal Multigrade filter Wash rooms, pantry, Cooling tower gets 18Kgal from RO1 reject and 40Kgal from RO2 reject Boiler reject RO1 Reject Softener Sterilizer reject Boiler feed. uses 23Kgal from RO1 & 10Kgal from still and rejects all. Distillation reject 18K gal Multigrade filter Softener RO1 RO2 Still 18K gal shall be channelised to wash room out of 40KL gal reject Sterilizer uses and rejects 12K gal 10K gal reject as backwash time shall be reduced by 5 mins 44K gal reject 10K gal overflow is channelised to RO1 Tank and 40K gal goes to wash room 10K gal reject now goes to boiler feed tank 10K gal of overflow 40Kgal of reject 213Kgal 203Kgal 159Kgal 119Kgal 94Kgal 44Kgal 34Kgal 10Kgal 44Kgal 22Kgal 45Kgal 0Kgal 0Kgal Achieved Unchanged Usage goal (K gal) = 213K gal / day Achieved usage = 233K gal / day Product Need = 34K gal/ day Plant Process Goal and Achievement
Next Page Previous Page Value Stream Mapping Strategies and Tools • Use icons to identify processes with EHS opportunities • Record environmental data for processes in VSMs • Analyze materials use vs. need in a “materials line” for VSMs • Expand the application of value stream mapping to natural resource flows • Find Lean and environment opportunities in future state VSMs
Next Page Previous Page 5. Find Lean and Environment Opportunities in Future State VSMs • Asking simple questions based on the current state VSM can help to envision a less-wasteful future state • Consider these questions: • Where are kaizen events needed to address the biggest areas of environmental wastes? (See the Kaizen Event Training Module) • Will any changes be made to the layout of processes marked with an EHS icon, or to the chemicals used by those processes? (These may have regulatory compliance implications) • Can one process use the “waste” material from another process instead of using virgin materials?
Next Page Previous Page Questions for the Future State, Continued • What are appropriate targets for improving environmental performance in the future state? • What would an environmentally-preferredfuturestate look like for the value stream? What if there were: • Zero environmental and production wastes? • Products and processes that pose no risks to human health or the environment? • No need for environmental permits? • What steps can be taken to get to that future state?
Daily schedule Next Page Previous Page Example Future State VSM Production Control Market Forecast Annual Production Plan Customer A Customer B Supplier 1 Supplier 2 Daily schedule D I 2x Week Shipping EHS EHS EHS Assembly & Inspection Milling Welding Painting 2 people 2 people 3 people 3 people C/T = 2 min C/O = 2 hr Uptime = 74% C/T = 4 min C/O = 3 hr Uptime = 61% C/T = 7 min C/O = 4 hr Uptime = 48% C/T = 2 min C/O = 30 min Uptime = 93% 8 days 10 days 5 days 15 days 2 min 7 min 2 min 4 min <90 lbs 15 lbs 20 lbs <25 lbs 5 lb 20 lbs 80 lbs 5 lbs Lead Time = 68 days Value Added Time = 15 min Total Materials Used < 150 lbs Materials Needed = 110 lbs Details
Next Page Previous Page Future State VSMs: Planning for Lean Implementation • When developing Lean implementation plans in future state VSMs, keep in mind that some processes may require special attention to EHS issues • Processes with regulatory requirements • Other processes with EHS icons • Early involvement of EHS staff in planning for Lean events on these processes can help: • Anticipate changes needed to environmental compliance practices • Bring a fresh perspective and additional resources to Lean waste-reduction activities • Prevent harm to worker health and safety
Next Page Previous Page Beyond Value Stream Mapping • Hierarchical process mapping offers a way to “drill down” from VSMs to find more EHS wastes and process improvement opportunities • Uses a tiered approach to examine steps within a process in a VSM • Helps teams find root causes of waste • Includes additional info on resource inputs, non-product outputs, regulatory requirements, & costs • See the Kaizen Event Training Module for more information about this method
Next Page Previous Page Reflections on Value Stream Mapping Opportunities • What did you learn from this training module that was particularly useful? • What questions do you have about the value stream mapping strategies and tools presented? • What other ideas do you have to improve the environmental performance of your organization with value stream mapping?
Next Module Previous Page EPA Lean and Environment Training Modules • For more information about EPA’s Lean and Environment Training Modules, visit: www.epa.gov/lean • EPA is interested in learning from organizations’ experiences with Lean and environment, and welcomes your comments on this training module • Please contact EPA by using the form found at http://www.epa.gov/lean/auxfiles/contact.htm
What is Environmental Waste? • Environmental waste is either: • an unnecessary use of resources, or • a substance released to the air, water, or land that could harm human health or the environment • Examples of environmental wastes include: • Excess (non-value-added) use of energy, water, or materials to meet customer needs • Air and water pollution • Hazardous wastes, trash, discarded scrap • See the Identifying Environmental Waste Training Module Back to Main Presentation
More Information on Value Stream Mapping • In the book Lean Thinking, James P. Womack and Daniel T. Jones defined value stream mapping as: • “Identification of all the specific activities occurring in a value stream for a product or product family” • Value stream mapping is a manager’s tool for understanding how information and materials flow between processes to deliver value to a customer • This “big-picture,” customer-oriented view of an organization’s activities allows Lean implementers to identify and prioritize future improvement efforts Next Page Back to Main Presentation
Steps in Value Stream Mapping Typical steps in value stream mapping include: • Select a product family • Collect data on the current state of the value stream • Draw a current state value stream map, identifying waste (non-value-added activity) in the value stream • Brainstorm ideas to improve production flow, meet customer demand (takt time), and level product mix • Draw a future state value stream map, highlighting targets for Lean improvement efforts • Develop a kaizen implementation plan Back to Main Presentation Next Page Previous Page
Back to Main Presentation Previous Page Value Stream Mapping References • Rother, Mike and John Shook. Learning to See: Value-Stream Mapping to Create Value and Eliminate Muda. Brookline, MA: Lean Enterprise Institute, 2003. • Tapping, Don, Tom Luyster, and Tom Shuker. Value Stream Management: Eight Steps to Planning, Mapping, and Sustaining Lean Improvements. New York:Productivity Press,2002. • Womack, James P. and Daniel T. Jones. Lean Thinking: Banish Waste and Create Wealth in Your Corporation. Second Edition.2003.
WK I Milling 2 people C/T = 2 min C/O = 2 hr Uptime = 74% Key to Symbols on Current State VSM Production process (with data box) C/T Cycle time C/O Changeover time Inventory Truck shipment External sources (suppliers, customers, etc.) Electronic Information flow Movement of production material Back to Main Presentation
Resources for Processes with EHS Wastes and Opportunities • A wealth of process-specific waste elimination information, detailing techniques & technologies, is available from national and regional “pollution prevention” clearinghouses • For more information, see: • U.S. Environmental Protection Agency Pollution Prevention (P2) website – www.epa.gov/p2 • Pollution Prevention Resource Exchange – www.p2rx.org • U.S. Department of Defense Pollution Prevention Technical Library – p2library.nfesc.navy.mil Back to Main Presentation
EPA’s Lean and Environment Basic Environmental Measures (1 of 5) • EPA has assembled a list of environmental metrics that may be of use to organizations implementing Lean • The metrics are derived from EPA’s Green Supplier Network and Performance Track Program • The measures include priority chemicals that are of particular concern because of their toxicity, persistence in the environment, and/or their potential to bioaccumulate in organisms at higher levels in the food chain Next Page Back to Main Presentation
Environmental Performance Metrics (2 of 5) Previous Page Next Page Back to Main Presentation
Environmental Performance Metrics (3 of 5) Previous Page Next Page Back to Main Presentation
Environmental Performance Metrics (4 of 5) Previous Page Next Page Back to Main Presentation
Environmental Performance Metrics Resources (5 of 5) • Companies and other non-governmental organizations have also developed guidance on environmental metrics • The Global Reporting Initiative provides guidance for company-wide environmental and sustainability metrics – see www.globalreporting.org • The Facility Reporting Initiative provides guidance for facility-wide environmental and sustainability metrics – see www.facilityreporting.org • While these resources do not focus explicitly on process level environmental metrics, most of the metrics in these frameworks can be considered and applied at process or sub-process levels Previous Page Back to Main Presentation
Materials Line: Important Considerations • While material use can typically be determined, it is not always easy to identify what materials are “needed” or “value added” from the customer’s perspective • One approach is to count all materials used in a process that are incorporated in the product as “needed” • However, it may be possible to meet customers’ need with even fewer materials—this raises important questions for product design Next Page Back to Main Presentation
Materials Line: Important Considerations, Continued • In some cases, materials may play an important role in a process even though they do not directly add value for the customer • The materials line raises the question: “Is this material needed in the process or is there a better way?” • For example: • Solvents can be useful for cleaning processes even though they often are released to air during the process • In some cases, solvents could be replaced by water, compressed air, etc., or the cleaning step can be eliminated by avoiding soiling the part in the first place Previous Page Back to Main Presentation
Next Page Back to Main Presentation Example Future State VSM (1 of 2) • This future state VSM has kaizen starbursts for: • Lean Improvements: Converting from a “push” system to a “pull” production system using kanban (signals) and supermarkets (controlled inventories of parts) • Environmental Improvements: Reducing the amount of materials used by conducting Lean events on the milling and painting processes • In this example, the target is to reduce total materials use to less than 150 lbs. per shift
Example Future State VSM (2 of 2) Additional Symbols on the Future State VSM Supermarket (a controlled inventory of parts) Withdrawal (pull of materials, usually from a supermarket) Production Kanban (card or device that signals to a process how many of what to produce) Signal Kanban (shows when a batch of parts is needed) Kaizen Starburst (identifies improvement needs) Previous Page Back to Main Presentation