Deriving AD
The IS-LM model illustrates the relationship between income levels and interest rates, highlighting how the LM curve depends on money demand, which is influenced by the price level. For example, with a price level ( P = 100 ), the equilibrium income ( Y_1 ) reflects one point on the aggregate demand (AD) curve. As the price level changes to ( P = 110 ), a new equilibrium income ( Y_2 ) is established, leading to different points on the AD curve. This dynamic shows how shifts in price levels affect aggregate demand and overall economic equilibrium.

Deriving AD
E N D
Presentation Transcript
Deriving AD From IS-LM Model
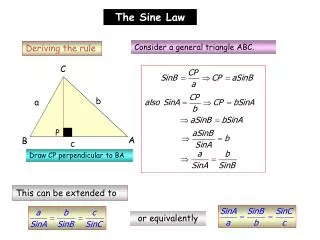
IS - LM • LM curve is function of money demand, which is function of price level So each LM is associated with a given price level LM IS
IS - LM • Let LM1 be associated with P = 100 And this will generate an equilibrium level of income, Y1. So, P = 100 & Y = Y1 gives one point on AD curve LM IS Y1
Aggregate Demand So, P = 100 & Y = Y1 gives one point on AD curve P 100 Y1
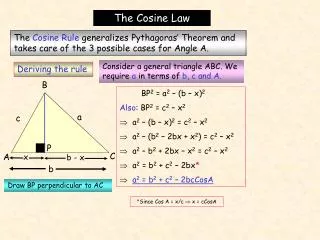
IS - LM • So, if we change P to 110, LM will change And this will generate a new equilibrium level of income, Y2. So, P = 110 & Y = Y2 gives one more point on AD curve LM’(110) LM(100) IS Y2 Y1
Aggregate Demand So, P = 110 & Y = Y2 gives one more point on AD curve P 100 Y1
Aggregate Demand Thus, two points on aggregate demand curve P 110 100 AD Y2 Y1