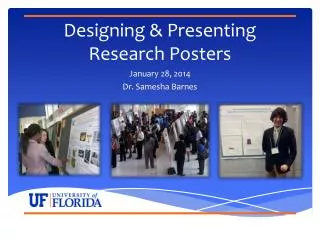
Guidelines for Creating Effective Research Posters
This guide outlines essential strategies for creating impactful research posters. It covers the purpose of research posters, detailing how to effectively present findings and engage audiences, whether actively or passively. The process involves determining the contents, such as the title, research question, methodology, results, and conclusions. It emphasizes design principles including dimensions, text layout, color balance, and effective use of charts. Resources and software tips are also provided to ensure your poster communicates your research effectively and stands out in presentations.


Guidelines for Creating Effective Research Posters
E N D
Presentation Transcript
Creating Research Posters Andrew J. Younge Indiana University
Outline Purpose Process Design Sources Practice
Purpose What is the purpose of a research poster?
Purpose • What is the purpose of a research poster? • Present research • Findings/completed work • Proposed/early stage work • Presentation styles • Active – you are standing by your work • Passive – you are not standing by your work
Process Determine contents (not layout)
Process • Determine contents (not layout) • Title • Answer to research question • Method • Results • Images • Charts • Conclusion • Sources • Acknowledgements
Design Dimensions Balance Text Charts Color Order of Information Software
Dimensions http://www.swarthmore.edu/NatSci/cpurrin1/posteradvice.htm Know your constraints! Landscape vs. Portrait Venue
Balance http://www.ncsu.edu/project/posters/NewSite/CreatePosterLayout.html
Text • Minimize use – think VISUAL • Bulleted lists preferred over paragraphs • Should be readable from 1-2 m (3-6 ft) • Organize in blocks • Columns help organize the organization • Not too big, not too small
Charts • Avoid “Chart Junk” • Use Headings that describe results http://www.ncsu.edu/project/posters/NewSite/SideWindows/MessageExample.html
Purposes of a a graph/visualization • Permit exploration – seek understanding • Provide communication – tell a story • Support calculation – visual algorithms • Bring information alive – give impact Adapted from Howard Weiner, 1997
What is the number? http://colorvisiontesting.com/what%20colorblind%20people%20see.htm
RGB vs. CMYK Screens are RGB Printers are CMYK Crude distinction, but basically true Set the color palette to CMYK if possible
Order 3 1 2
Software • Powerpoint • Set page size to dimensions of output • May not scale fonts appropriately • Adobe Illustrator/Photoshop
Sources • Research Posters 101 • http://www.acm.org/crossroads/xrds3-2/posters.html • Poster Presentations • http://lorien.ncl.ac.uk/ming/dept/Tips/present/posters.htm • Google “Designing Research Posters”