Download
1 / 22
220 likes | 456 Vues
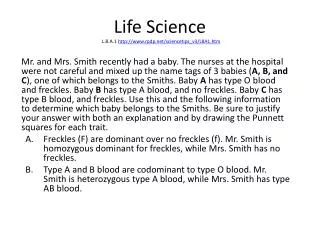
Life Science L.8.A.1 http://www.rpdp.net/sciencetips_v3/L8A1.htm.

E N D
Life Science L.8.A.1 http://www.rpdp.net/sciencetips_v3/L8A1.htm Mr. and Mrs. Smith recently had a baby. The nurses at the hospital were not careful and mixed up the name tags of 3 babies (A, B, and C), one of which belongs to the Smiths. Baby A has type O blood and freckles. Baby B has type A blood, and no freckles. Baby C has type B blood, and freckles. Use this and the following information to determine which baby belongs to the Smiths. Be sure to justify your answer with both an explanation and by drawing the Punnett squares for each trait. • Freckles (F) are dominant over no freckles (f). Mr. Smith is homozygous dominant for freckles, while Mrs. Smith has no freckles. • Type A and B blood are codominant to type O blood. Mr. Smith is heterozygous type A blood, while Mrs. Smith has type AB blood.
Life Science L.8.A.1 http://www.rpdp.net/sciencetips_v3/L8A1.htm • Both Punnett squares should be drawn and completed correctly. • Results for freckles: • There is 100% probability that Mr. and Mrs. Smith would have a child with freckles. Therefore, Baby B cannot belong to them because it does not have freckles. • Results for blood types: • The Punnett squares show that Mr. and Mrs. Smith can only have babies with the blood types A, B, or AB. Baby A has type O blood and cannot be theirs. • By using the results of the Punnett squares and the process of elimination, Baby C should belong to Mr. and Mrs. Smith. Punnett Square for Freckles Punnett Square for Blood Types
Life Science L.8.B.1 http://www.rpdp.net/sciencetips_v3/L8B1.htm Both organisms in Diagram A and B can be seen only with a microscope. Since these are one-celled organisms, each cell must be able to carry out all important life functions, such as moving from place to place and getting food. Diagram A Diagram B Infer from the diagram the ways these two organisms move. Be sure to include information from the diagrams in your answer. Compare the ways these two organisms obtain nutrients. Determine if each organism is a heterotroph or autotroph. Be sure to include information from the diagrams in your answer.
Life ScienceL.8.B.4 http://www.rpdp.net/sciencetips_v3/L8B4.htm The diagram below shows the digestive system of an earthworm. • Compare the earthworm’s digestive system to a human’s digestive system. Identify three digestive organs in the earthworm that are also found in the human body. • Provide a detailed description of the function that each organ you identified in part (A) has in the human body.
Life Science L.8.B.5 http://www.rpdp.net/sciencetips_v3/L8B5.htm A group of students took potato salad made with mayonnaise to a picnic on a very hot day. • Explain how eating the potato salad that is not refrigerated could cause food poisoning. • Why would refrigerating the potato salad prevent the people who eat it from getting food poisoning?
Life ScienceL.8.C.1 http://www.rpdp.net/sciencetips_v3/L8C1.htm The organisms in an ecosystem interact in many ways to survive. For example, a rosebush, aphids, beetles, spiders, and orioles all interact in a rosebush ecosystem. The diagram on the next slide shows how these organisms interact in a partial food web. • Identify the producer organism in this food web. Explain the reasoning for your answer. • Identify the primary consumer organism in this food web. Explain the reasoning for your answer. • Predict what would most likely happen to each of the organisms in the food web if the beetle population were suddenly destroyed. Explain the reasoning for your answer for each organism. From http://www.doe.mass.edu/mcas/
Identify the producer organism in this food web. Explain the reasoning for your answer. • Identify the primary consumer organism in this food web. Explain the reasoning for your answer. • Predict what would most likely happen to each of the organisms in the food web if the beetle population were suddenly destroyed. Explain the reasoning for your answer for each organism.
Life ScienceL.8.C.4 http://www.rpdp.net/sciencetips_v3/L8C4.htm The data table shows the number of rabbits that lived in a grassland habit over a ten year period. • Use the data to graph the growth of the rabbits over the ten year period. Be sure to correctly label the X and Y axes. • What is meant by the term carrying capacity? Identify on the graph where the carrying capacity for the rabbits occurs. • Describe the effect that a specific abiotic and biotic factor could have on the carrying capacity of this grassland habit.
Life ScienceL.8.C.4 http://www.rpdp.net/sciencetips_v3/L8C4.htm Carrying Capacity Number of Rabbits Time (Years)
Life ScienceL.8.D.3 http://www.rpdp.net/sciencetips_v3/L8D3.htm • The graph shows the number of gray squirrels in a small population and their coat colors. This squirrel population has been separated from other squirrel populations by a new highway and several construction sites. The main predators of these squirrels are cats and hawks. • Assume that dark gray squirrels are very visible in this new environment. What will most likely happen to the distribution of coat color in this squirrel population over several generations? • Using graph paper, sketch a graph to show the predicted distribution of the squirrel population, and explain your answer. • Assume that dark gray squirrels are very visible on the ground, and light gray squirrels are very visible in the trees. Explain what is likely to happen to the distribution of coat color in the squirrel population over several generations. Graph from http://www.doe.mass.edu/mcas/
Life ScienceL.8.D.3 http://www.rpdp.net/sciencetips_v3/L8D3.htm
Earth ScienceE.8.A.1 http://www.rpdp.net/sciencetips_v3/E8A1.htm Draw a diagram the Earth in its orbit around the Sun and include the following labels and explanations. • The Earth’s tilt must be represented along with labels for each solstice and equinox as experienced in the Northern Hemisphere. The terms summer solstice, winter solstice, vernal (spring) equinox, and autumnal (fall) equinox must be used. • Identify the position that shows the Southern Hemisphere receiving the greatest and least amount of direct solar energy. Provide evidence to support these choices. • Predict what the seasons would be like on Earth if there were no axial tilt.
Earth ScienceE.8.A.1 http://www.rpdp.net/sciencetips_v3/E8A1.htm Autumnal Equinox Winter Solstice Summer Solstice Summer Solstice in Southern Hemisphere Vernal Equinox Winter Solstice in Southern Hemisphere Not drawn to scale
Earth Science E.8.B.7 http://www.rpdp.net/sciencetips_v3/E8B7.htm Answer each of the following questions regarding a solar eclipse. • Describe why a solar eclipse occurs. • Draw a labeled diagram of a solar eclipse including the moon, Sun, and Earth. • Explain why an observer’s ability to view a total solar eclipse would depend on the observer’s location on Earth.
From: http://eclipse.gsfc.nasa.gov/solar.html • A solar eclipse occurs when the moon passes between the Earth and the Sun. The moon blocks out the view of the Sun for viewers on Earth. • Due to the size of the moon, only a small amount of viewers on Earth would see a total solar eclipse due to the small area of the shadow cast on Earth.
Earth ScienceE.8.C.4 http://www.rpdp.net/sciencetips_v3/E8C4.htm A scientist studying these two land masses hypothesizes that the land masses were once together. • Using the diagram, identify and explain two pieces of evidence that support the scientist’s theory that the land masses were once together. • Use your knowledge of plate tectonics to propose a reason why the land masses moved to their current position. • If the crustal movement continues, predict where the land masses will move in the future. • The diagram on the next slide shows two land masses separated by an ocean. Use the key to the right to aid in your written explanation. From http://www.doe.mass.edu/mcas/
Earth ScienceE.8.C.4 http://www.rpdp.net/sciencetips_v3/E8C4.htm • The diagram shows two land masses separated by an ocean. Use the key to the right to aid in your written explanation.
Earth ScienceE.8.C.8 http://www.rpdp.net/sciencetips_v3/E8C8.htm The diagram showing a soil profile might assist you in answering the following questions. • List and describe two factors that affect water retention in soil. • Describe the relationship between particle size and the ability of the soil to retain water. • Explain why the soil that forms in a desert climate will differ from the soil that forms in rainforest climate.
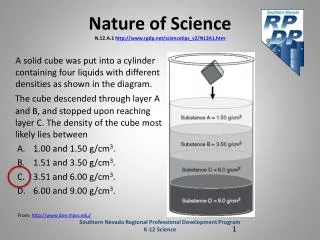
Physical ScienceP.8.A.3 http://www.rpdp.net/sciencetips_v3/P8A3.htm A demonstration is performed using this cylinder (shown to the right), a small rubber ball, and three liquids. The liquids are mercury (density of 13.4 g/mL), vegetable oil (density of 0.8 g/mL), and water (density of 1.0 g/mL), which are poured into the cylinder. • Draw and label the arrangement of these three liquids within the cylinder. Justify the reasons for your arrangement of the liquids. • The small rubber ball, with a density of 0.9 g/mL, is dropped into the cylinder with the liquids. Predict where the ball will stop, draw it on the diagram, and justify your reasoning.
Physical ScienceP.8.C.2 http://www.rpdp.net/sciencetips_v3/P8C2.htm Sound is a form of energy that is transmitted through vibrations. • Describe how sound waves are affected by their frequency and the medium through which the sound wave passes. • A science fiction film shows an explosion in space that is heard by the space travelers on board a spaceship. Critique this portrayal and provide evidence for your argument.
Physical ScienceP.8.C.3 http://www.rpdp.net/sciencetips_v3/P8C3.htm This picture shows the path that energy takes from the power plant to your home. • Starting at the power plant, explain what form the energy is in. As the energy travels to the next location in the picture, explain how the energy is transformed. Continue explaining how energy is transformed until it reaches the end user (labeled “industrial use,” “commercial use,” and “home use”). Some transitions may contain more than one transformation. • Will all of the energy from the power plant reach the end users? Justify why or why not. From: http://www.tvakids.com/electricity/transmission.htm
Physical ScienceP.8.C.5 http://www.rpdp.net/sciencetips_v3/P8C5.htm The illustration shows a container of water on an electric hot plate. Point A represents the point closest to the heat source and point B is near the top of the container. The water in the container is at room temperature before the hot plate is turned on. • Describe the differences in the average motion of the water molecules at point A and at point B shortly after the hot plate is turned on. • The water is heated until a thermometer placed in the center of the container reaches 100°C. Compare the average motion of the water molecules at points A and B at this temperature and explain your answer. • The hot plate is then turned off. Predict the average motion of the molecules at points A and B after several hours.