Statistical Quality Control
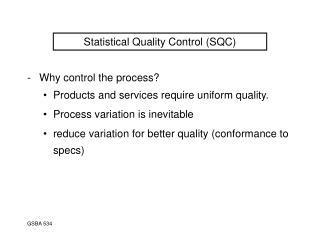
Statistical Quality Control. Basic Concepts Aim Tools Advantages. Basic Concepts. When small samples are taken continuously on a regular basis, and the data analysed statistically, valuable information can be derived. Control charts forms an integral part of production process.

Statistical Quality Control
E N D
Presentation Transcript
Statistical Quality Control • Basic Concepts • Aim • Tools • Advantages
Basic Concepts • When small samples are taken continuously on a regular basis, and the data analysed statistically, valuable information can be derived. • Control charts forms an integral part of production process. • Provides timely warning signal & for corrective action.
Basic Concepts • The effectiveness of control charts depends on how promptly, the warning is understood and heeded and necessary action taken to correct the process. • Helps manufacturer in identifying and eliminating causes for defectives or failures in repetitive production processes.
Basic Concepts • SQC is the primary analysis tool of quality improvement. • It is the applied science that helps you collect, organize and interpret the wide variety of information available to your business.
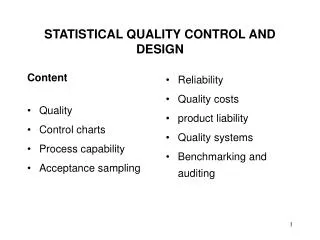
Aim • To Achieve Defect Prevention. • To Pursue Never-ending Improvement. • To Reduce Variability, Delivery Times, Completion Times, Methods, Attitudes, Equipment and Material. • To Produce Components Consistently within Specifications. • To give us Statistical Signal when Special causes of Variation are Present.
Tools • Flow chart to understand what is being done. • Check sheets & tally charts to observe the frequency of occurrence of the process. • Graphs to see the pictorial representation of the numbers. • Cause and effect analysis to study the causes of the problems.
Tools • Pareto analysis to segregate serious problems from the minor once. • Scatter diagrams to study the relationship between various interacting factors. • Control charts to interpret and decide which variations to control and go about. • Histograms to appreciate as to how the variations in frequency of occurrence appear.
Advantages • Greater consistency in fulfilling customer's requirements leads to greater customer satisfaction. • Reduced variation in internal processes leads to less time and money spent on rework and waste.
Advantages • Greater consistency in fulfilling customer's requirements leads to greater customer satisfaction. • Reduced variation in internal processes leads to less time and money spent on rework and waste.
What Next? • Material Planning Budgeting • Material requirement planning.