Excel-Based Statistical Quality Control Charts: Learning Objectives and Process Insights
Learn to distinguish between controlled and uncontrolled variation, use Excel to create statistical control charts, interpret control charts, and more. Understand the Statistical Quality Control (SQC) process, origins, types of variation, and the importance of control charts. Gain insights into process monitoring, hypothesis testing, variable and attribute charts.


Excel-Based Statistical Quality Control Charts: Learning Objectives and Process Insights
E N D
Presentation Transcript
Statistical Quality Control Quality Control Charts using Excel
Learning Objectives • After this class the students should be able to: • Distinguish between controlled and uncontrolled variation • Distinguish between variables and attributes • Determine control limits for several types of control charts • Use graphics to create statistical control charts with Excel • Interpret control charts • Create a Pareto chart
Time management • The expected time to deliver this module is 50 minutes. 30 minutes are reserved for team practices and exercises and 20 minutes for lecture.
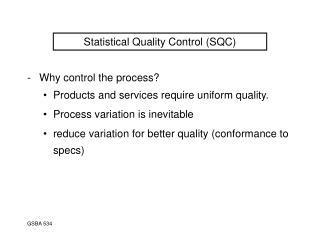
Statistical Quality Control (SCQ) Process • Any activity or set of activities that takes inputs and create a product. The process for an industrial plant takes raw materials and creates a finished product is an example. Statistical Quality Control (SQC) or statistical process control (SPC) • The analysis of processes for improving quality.
Origins • 1924 - Walter A. Shewhart • W. Edwards Deming,
Controlled Variation • There is Variation that you can never eliminate it totally. There are bound to be many small, unobservable, chance effects that influence the outcome. this kind of variation is said to be "in control," not because the process operator is able to control the factors absolutely, but rather because the variation is the result of normal disturbances, called common causes, within the process. • This type of variation can be predicted. In other words, given the limitations of the process, each of these common causes is controlled to the greatest extent possible.
Uncontrolled Variation • Variation that arise sporadically and for reasons outside the normally functioning process, induced by a special cause. • Special causes include differences between machines, different skill or concentration levels of workers, changes in atmospheric conditions, and variation in the quality of inputs. • Unlike controlled variation, uncontrolled variation can be reduced by eliminating its special cause.
Kind of Variation • Controlled • is native to the process, resulting from normal factors called "common causes“ • Uncontrolled • is the result of "special causes" and need not be inherent in the process
Control Charts • As long as the points remain between the lower and upper control limits, we assume that the observed variation is controlled variation and that the process is in control
Control Chart • The process is out of control. Both the fourth and the twelfth observations lie outside of the control limits, leading us to believe that their values are the result of uncontrolled variation.
Control Chart • Even control charts in which all points lie between the control limits might suggest that a process is out of control. In particular, the existence of a pattern in eight or more consecutive points indicates a process out of control, because an obvious pattern violates the assumption of random variability.
Control Chart • The first eight observations are below the center line, whereas the second seven observations all lie above the center line. Because of prolonged periods where values are either small or large, this process is out of control.
Control Chart • Other suspicious patterns could appear in control charts. Unfortunately, we cannot discuss them all here. • Control chart makes it very easy for you to identify visually points and processes that are out of control without using complicated statistical tests. • This makes the control chart an ideal tool for the shop floor, where quick and easy methods are needed.
Chart and Hypothesis testing • The idea underlying control charts is closely related to confidence intervals and hypothesis testing. The associated null hypothesis is that the process is in control; you reject this null hypothesis if any point lies outside the control limits or if any clear pattern appears in the distribution of the process values. • Another insight from this analogy is that the possibility of making errors exists, just as errors can occur in standard hypothesis testing. Occasionally a point that lies outside the control limits does not have any special cause but occurs because of normal process variation.
Variable and Attribute Charts • Categories of control charts: • those that monitor variables and • those that monitor attributes. • Variable charts display continuous measures, such as weight, diameter, thickness, purity, and temperature. Its statistical analysis focuses on the mean values of such measures. • Attribute charts differ from variable charts in that they describe a feature of the process rather than a continuous variable such as a weight or volume. Attributes can be either discrete quantities, such as the number of defects in a sample, or proportions, such as the percentage of defects per lot.
Using Subgroups • In order to compare process levels at various points in time, we usually group individual observations together into subgroups. • The purpose of the subgroup is to create a set of observations in which the process is relatively stable with controlled variation. • For example, if we were measuring the results of a manufacturing process, we might create a subgroup consisting of values from the same machine closely spaced in time. • A control chart might then answer the question "Do the averages between the subgroups vary more than expected, given the variation within the subgroups?"
Each point in the x-chart displays the subgroup average against the subgroup number: subgroup 2 occurring after subgroup 1 and before subgroup 3. • As an example, consider a clothing store in which the owner monitors the length of time customers wait to be served. He decides to calculate the average wait-time in half-hour increments. The first half-hour (for instance, customers who were served between 9 a.m. and 9:30 a.m.) forms the first subgroup, and the owner records the average wait-time during this interval. The second subgroup covers the time from 9:30 a.m. to 10:00 a.m., and so forth.
It is based on the standard normal distribution. • The standard normal distribution underlies the mean chart, because the Central Limit Theorem states that the subgroup averages approximately follow the normal distribution even when the underlying observations are not normally distributed.
The applicability of the normal distribution allows the control limits to be calculated very easily when the standard deviation of the process is known. 99.74% of the observations in a normal distribution fall within 3 standard deviations of the mean (u). In SPC, this means that points that fall more than 3 standard deviations from the mean occur only 0.26% of the time. Because this probability is so small, points outside the control limits are assumed to be the result of uncontrolled special causes.
To create a control chart of the teacher's scores: • Click StatPlus > QC Charts > XBar Chart. • Click the Subgroups in rows across columns option button. • Click the Data Values button and select the range names Score -1 through Score 5. Click OK. • Click the Sigma Known checkbox and type 5 in the accompanying text box. • Click the Output button and send the control chart to a new chart
Analysis • No mean score falls outside the control limits. The lower control limit is 77.462, the mean subgroup average is 84.17, and the upper control limit is 90.878. There is no evident trend to the data or nonrandom pattern. • Then, there is no reason to believe the teaching process is out of control.
Analysis • But, there is no evidence that this professor's performance was better or worse in one semester than in another. • The raw scores from the last three semesters are misleading. A student might claim that using a historical value for salso misleading, because a smaller value for s could lead one to conclude that the scores were not in control after all.
Analysis • One corollary to the preceding analysis should be stated: Because even a single professor experiences wide fluctuations in student evaluations over time, apparent differences among various faculty members can also be deceptive. You should use all such statistics with caution.
Control Limits when s is unknown • In many instances, the value of s is not known. The normal distribution does not strictly apply for analysis when s is unknown. In this case we will use t-distribution instead standard normal distribution. • Because SPC is often implemented on the shop floor by workers who have had little or no formal statistical training (and might not have ready access to Excel), the method for estimating a is simplified and the normal approximation is used to construct the control chart. • The difference is that when a is unknown, the control limits are estimated using the average range of observations within a subgroup as the measure of the variability of the process.
Control Limits when s is unknown • The control limits are • R represents the average of the subgroup ranges, and X is the average of the subgroup averages. Ai is a correction factor that is used in quality-control charts. There are many correction factors for different types of control charts.
QC Correction Factors • Source: Adapted from "1950 ASTM Manual on Quality Control of Materials," American Society for Testing and Materials, in J. M. Juran, ed., Quality Control Handbook (New York: McGraw-Hill, 1974), Appendix II, p. 39.
Using the data from a manufacturing firm that sprays one of its metal products with a special coating to prevent corrosion, create an X-chart and analysis the results. • The company has just begun to implement SPC. consequently, s is unknown. (20 minutes) Click here to see data
Reference • Data Analysis with Excel. Berk & Carey, Duxbury, 2000, chapter 12, p. 475-488