Market Analysis: Advertising Turnover
40 likes | 173 Vues
This market analysis report presents the advertising turnover trends for national, retail, and classified advertising from 1997 to 2006, as reported by the Advertising Standards Authority (ASA). Total advertising turnover across various media shows fluctuating trends, with newspapers, TV, and magazines experiencing declines, while online advertising surged significantly. This analysis captures the dynamics of the advertising landscape over a decade, noting the contribution of multiple companies and highlighting the challenge of year-on-year comparisons due to varying participation levels.

Market Analysis: Advertising Turnover
E N D
Presentation Transcript
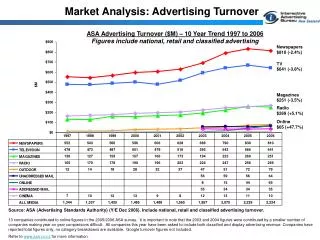
Market Analysis: Advertising Turnover ASA Advertising Turnover ($M) – 10 Year Trend 1997 to 2006 Figures include national, retail and classified advertising Newspapers $810 (-2.4%) TV $641 (-3.8%) Magazines $251 (-3.5%) Radio $269 (+5.1%) Online $65 (+47.7%) Source: ASA (Advertising Standards Authority) (Y/E Dec 2006). Include national, retail and classified advertising turnover. 13 companies contributed to online figures in the 2005/2006 ASA survey. It is important to note that the 2003 and 2004 figures were contributed by a smaller number of companies making year on year comparisons difficult. All companies this year have been asked to include both classified and display advertising revenue. Companies have reported total figures only, no category breakdowns are available. Google turnover figures not included. Refer to www.asa.co.nz for more information.
Market Analysis: Advertising Turnover ASA Advertising Turnover ($M) – 10 Year Trend 1997 to 2006 Figures include national, retail and classified advertising Source: ASA (Advertising Standards Authority) (Y/E Dec 2006). Include national, retail and classified advertising turnover. 13 companies contributed to online figures in the 2005/2006 ASA survey. It is important to note that the 2003 and 2004 figures were contributed by a smaller number of companies making year on year comparisons difficult. All companies this year have been asked to include both classified and display advertising revenue. Companies have reported total figures only, no category breakdowns are available. Google turnover figures not included. Refer to www.asa.co.nz for more information.
Market Analysis: Advertising Turnover ASA Advertising Turnover (Media Share %) Figures include national, retail and classified advertising +0.1% +0.4% +0.9% -0.1% +0.4% 2005 All Media $2,229M 2006 All Media $2,224M -0.8% -0.4% +0.6% -1.1% Source: ASA (Advertising Standards Authority) (Y/E Dec 2006). Include national, retail and classified advertising turnover. 13 companies contributed to online figures in the 2005/2006 ASA survey. It is important to note that the 2003 and 2004 figures were contributed by a smaller number of companies making year on year comparisons difficult. All companies this year have been asked to include both classified and display advertising revenue. Companies have reported total figures only, no category breakdowns are available. Google turnover figures not included. Refer to www.asa.co.nz for more information.
Market Analysis: Advertising Turnover ASA Advertising Turnover ($M) Figures include national, retail and classified advertising Source: ASA (Advertising Standards Authority) (Y/E Dec 2006). Include national, retail and classified advertising turnover. 13 companies contributed to online figures in the 2005/2006 ASA survey. It is important to note that the 2003 and 2004 figures were contributed by a smaller number of companies making year on year comparisons difficult. All companies this year have been asked to include both classified and display advertising revenue. Companies have reported total figures only, no category breakdowns are available. Google turnover figures not included. Refer to www.asa.co.nz for more information.