Download
1 / 20
210 likes | 707 Vues
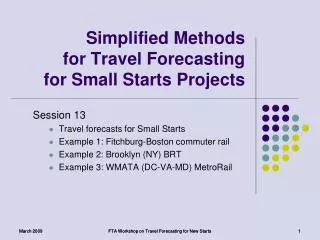
Before-and-After Studies – Examples. Session 12 Interstate MAX LRT in Portland Joe Recker, TriMet Jennifer John, John Parker Consulting Newark-Elizabeth Rail Link Bill Woodford, AECOM Charlotte South Corridor LRT Bill Woodford, AECOM.

E N D
Before-and-After Studies – Examples Session 12 Interstate MAX LRT in Portland Joe Recker, TriMet Jennifer John, John Parker Consulting Newark-Elizabeth Rail Link Bill Woodford, AECOM Charlotte South Corridor LRT Bill Woodford, AECOM FTA Workshop on Travel Forecasting for New Starts
Before-and-After Study for Interstate MAX LRT in PortlandKey Findings and Lessons Learned Joe Recker TriMet Jennifer John John Parker Consulting Presented by Ken Cervenka FTA March 2009 FTA Workshop on Travel Forecasting for New Starts FTA Workshop on Travel Forecasting for New Starts 2
Project Description • Planning began in 1980’s • Bi-state south/north corridor • Project salvaged from failed bond measure for entire corridor • 5.8-mile extension (10 new stations) north from existing 33-mile east-west system • Bus service replaced with light rail • Traffic lanes replaced with exclusive transit lanes FTA Workshop on Travel Forecasting for New Starts
Project Purpose • Provide a faster/more reliableconnection to largest employment center in region - downtown • Serve commuter market • Majority of trips in/out of the downtown • Intercept trips crossing the river through park and ride facilities and bus transfer points at the northernmost terminus of the route • Other goals included: • Maximize effectiveness and efficiency of transit system in older, urban neighborhood • Support land use goals • Accommodate future growth FTA Workshop on Travel Forecasting for New Starts
Weekday Project Ridership • 2005 forecast (completedin 2000) – 13,900 • Opened May 2004 for revenue service • Spring 2005 – 11,830 • Spring 2007 – 12,900 • Spring 2008 – 13,800 • Summer 2008– 14,700 • Aggregate ridership forecast pretty good • Insights are gained from delving deeper into the forecasts at a more disaggregate level FTA Workshop on Travel Forecasting for New Starts
Weekday Corridor Ridership FTA Workshop on Travel Forecasting for New Starts
Transit Rider Travel Patterns FTA Workshop on Travel Forecasting for New Starts
Distribution by Trip Purpose FTA Workshop on Travel Forecasting for New Starts
Predicted – Roughly 2% annual growth thru 2025 Actual – Roughly 2% contraction of employment between planning and project opening (national recession) Opening year interpolated from horizon year forecast (not a 2005 land use allocation process) Economic cycles impact land use projections more in the short term than long term Land Use FTA Workshop on Travel Forecasting for New Starts
Service Levels • Predicted • Replace bus with rail • Reallocate bus service to rest of N/NE Portland • Actual • Modest service changes • Generally met expectations • Issues • Line coding checks • Horizon vs. opening year service planning FTA Workshop on Travel Forecasting for New Starts
Understand software Emme2 multipath assignment Mode of access Park-and-ride assumptions Walk connections Transfer rates Modeling Inputs FTA Workshop on Travel Forecasting for New Starts
Overall Ridership By Station FTA Workshop on Travel Forecasting for New Starts
Predicted: heavy transfer activity to MAX trunk line Actual: long walk at transfer point with 2-3 signalized crossings – fewer transfers 30% fewer transfers and 18% less station activity than forecast Rose Quarter Transit Center Interstate MAX Blue/Red Lines FTA Workshop on Travel Forecasting for New Starts
Predicted: walk access to dense employment/ medical center TAZ Actual: indirect, uphill walk connection to that TAZ on narrow sidewalk underneath freeway 67% less station activity than forecasts Albina/Mississippi Station FTA Workshop on Travel Forecasting for New Starts
Predicted: typical urban neighborhood station with mix of walk and transfer access Household and employment projections not realized Standard coding conventions utilized in model, did not reflect actual access to the station 75% actual walk access vs. 54% forecasted Killingsworth Station ½ Mile Buffer TAZs not connected to station FTA Workshop on Travel Forecasting for New Starts
Predicted: main access station for Vancouver residents via park-and-ride and Line 5 bus transfer Actual: State DOT didn’t allow bus/car access from freeway expected in model Park-and-ride and buses routed to different station Transfers occurred at Lombard – 17% more station activity there Park-and-ride underutilized Expo Center Station Anticipatedvs.ActualAccess Plan FTA Workshop on Travel Forecasting for New Starts
Overlook: Actual land use and access modes close to forecast – 2% higher station activity than forecasted Kenton and Lombard: Unanticipated transfers led to higher actual station activity – 5% and 17% over forecast, respectively Delta Park/Vanport: Recent direct access to C-Tran transit market – 2008 actual station activity 11% over forecast Other Stations FTA Workshop on Travel Forecasting for New Starts
Line 5 vs. Interstate MAX MAX riders more likely to… Walk further Drive to transit Need fewer transfers to complete trip Own a car Have higher incomes Make more occasional trips Before-versus-After Observations FTA Workshop on Travel Forecasting for New Starts
Key Takeaways • Portland Metro has a good model that has been calibrated with LRT experience in place • Use available tools (GIS, Google Earth, existing service/operational data, along with understanding of software) for realistic coding conventions in networks • These before and after studies help us understand ridership and aid in forecast assumptions (“unofficial” park-and-riders) • Economic cycles unpredictable – attention to detail in land use forecasts is important • While in the past, opening year was not main focus of modeling/New Starts in terms of reporting process, it is very important FTA Workshop on Travel Forecasting for New Starts