Fatigue Striation Spacing Measurement
240 likes | 615 Vues
Fatigue Striation Spacing Measurement. David M. Christie Senior Failure Analyst IMR Test Labs. Fatigue Striation Spacing: Why?. Obtain ACTUAL crack growth rates (Da/DN)

Fatigue Striation Spacing Measurement
E N D
Presentation Transcript
Fatigue Striation Spacing Measurement David M. Christie Senior Failure Analyst IMR Test Labs
Fatigue Striation Spacing: Why? • Obtain ACTUAL crack growth rates (Da/DN) • Models, Fatigue testing, and Fracture toughness testing can predict crack growth rates, but field failures are “the proof” of what is happening in the real world. • The real world is complex, making measurement and interpretation of striation spacing a challenge.
Striation Spacing • Striation spacing is on the order of 10–9 to 10–6 m/cycle • the required magnification to resolve a striation spacing of 5 × 10⁻⁵ mm is approximately 600× • in practice, magnification of 1000–20,000× is needed for comfortable counting • any fractographic feature similar in appearance to striations that is visible at lower magnifications (~ 500×) may well be something else
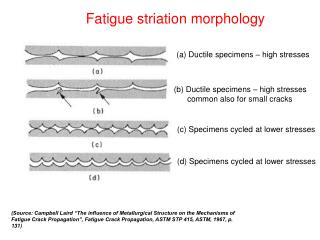
Fatigue Striation Spacing Assumptions: • There is a one to one relationship between stress cycles and striation formation. • This is not always the case! • Low amplitude stress intensity does not always result in a striation. • “Medium” amplitude stress intensity more frequently results in consistent striation production with every stress cycle.
Fatigue Striation Spacing Assumptions: • Actual Striations are Measured • Sometimes the finest striations are missed – this can be due to complex stress cycles and inadequate resolution in the SEM. • Even in consistent load fatigue-test conditions, striation fineness is variable. • For many materials and stress intensities striations are poorly produced, or not produced at all. • The fatigue surface is microscopically planar and normal to the electron beam • This is highly unlikely, and will result in errors
Fatigue Striation Spacing Assumptions: • That crack growth is roughly linear • While there is usually a region of stable crack growth, there is typically some variability in striation spacing from the origin to the final fracture zone. • That the exact path of the crack can accurately be determined – origin to final rupture zone. • Crack length is often difficult to obtain, depending on part geometry.
Other Difficulties: • Within a single field of view at 5,000 – 20,000x fatigue striation spacing may vary by a factor of 2 or more. • Striation spacing is a tedious procedure: • The accuracy of the results depends on many data points • Striation spacing will only enable estimation of the number of cycles from fatigue initiation to final rupture – NOT the total number of stress cycles experienced! (up to 90% of fatigue life is in crack initiation)
Striation Spacing Example: Fatigue Surface – diffuse lighting…. The extent of fatigue is easy (Dashed yellow line) Where is the origin?
Striation Spacing Example: Two origins complicates things a bit….. (use glancing light to reveal radial lines)
Striation Spacing Example: The presence of faint beachmarks and a strong ratchet mark (yellow dotted line) enables some assumptions to be made regarding the crack path. The green lines are approximations of the crack path. For calculating the number of cycles of active crack growth, which green line do we choose?
Striation Spacing Example: In each field of view, sets of well-defined striations are measured. The total length is divided by the total number of striations for each field. An average spacing is generated. Near Fracture Origin
Striation Spacing Example: Near Fracture Center
Striation Spacing Example: Near Fracture End
Striation Spacing Example: Significant variation in striation spacing is possible within a single field of view at high magnification. Each of the bracket lines is four striations long. Note the variation in length of these lines!