Understanding Explained and Unexplained Variance in Statistical Analysis
This article delves into the concepts of explained and unexplained variance in statistical models, illustrating how total variance (SStotal) is composed of both explained variance (SSexplained) and unexplained variance (SSunexplained). We explore the significance of the correlation coefficient (r), which reflects the linear relationship between two variables and enhances predictability. Additionally, we introduce Spearman’s Rank Order Correlation, a non-parametric method that utilizes ranked data, without requiring estimates of population parameters for means or variances, making it a useful tool in statistical analysis.

Understanding Explained and Unexplained Variance in Statistical Analysis
E N D
Presentation Transcript
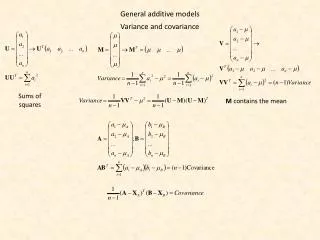
SStotal = SSexplained+SSunexplained N N N Explained and unexplained variance SStotal = SSexplained + SSunexplained
σ2Y’ [ =unexplained] σ2Y [ =total] Explained and unexplained variance r2XY = 1 -
σ2Y’ [ =unexplained] σ2Y [ =total] Explained and unexplained variance r2XY = 1 - σ2Y - σ2Y’ = σ2Y r2 is the proportion explained variance to the total variance.
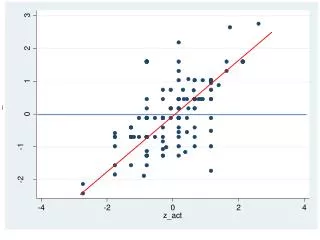
What is r? • r is an expression of the linear relationship between two variables … • Expressed in terms of standard deviation units, it puts a value on the predictability of one variable from the other. • Expressed in terms of variance (r2), it is the term that maximizes the proportion of explained variance and minimizes the proportion of unexplained variance.
Spearman’s Rank Order Correlation • A non-parametric test using ranked (ordinal) data. • It does not estimate population parameters for means or variances – if you use ranked data, the parameters are known (the mean of 5 (1,2,3,4,5) ranks is always 3.