Introduction Of Powerbi Desktop -Visualpath
0 likes | 35 Vues
<br>Visualpath is the no 1 institute for Power BI Course in Ameerpet Hyderabad with complete real-time-based Training by Real Time Experts with Power BI Online Training Course Interview Questions and Recorded Videos. Avail complete Power BI Online Training in, USA, Canada, UK, and Australia. Enroll Now for FREE DEMO. Call on 91-9989971070<br>visit us on : https://www.visualpath.in/powerbi-training.html

Introduction Of Powerbi Desktop -Visualpath
E N D
Presentation Transcript
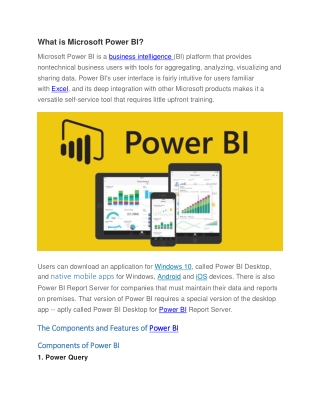
Getting Started with Power Bi Desktop -Visualpath Power BI Desktop is a powerful business intelligence tool developed by Microsoft, designed to help users visualize and analyze data from various sources. Whether you're a data analyst, business user, or a developer, Power BI Desktop offers a user-friendly interface and robust functionality to create interactive reports and dashboards. Here's an introduction to some key features and components of Power BI Desktop: 1. Data Connectivity: Power BI Desktop allows you to connect to a wide range of data sources including databases, files, online services, and more. You can import data from sources like Excel, SQL Server, SharePoint, Salesforce, Google Analytics, and many others. 2. Data Preparation: Once connected to a data source, Power BI Desktop provides tools for data transformation and cleansing. You can shape your data using features like Power Query Editor to clean, filter, merge, and manipulate data before loading it into your data model. Power BI Training in Hyderabad
3. Data Modeling: Power BI Desktop includes a powerful data modeling engine that lets you create relationships between different data tables. You can define measures, calculated columns, and hierarchies to enrich your data model and make it more meaningful for analysis. Power BI Training 4. Report Authoring: With Power BI Desktop, you can create interactive and visually appealing reports using a drag-and-drop interface. You can add various visualization types such as charts, graphs, tables, maps, and custom visuals to convey insights effectively. Power BI Training in Ameerpet 5. DAX (Data Analysis Expressions): DAX is the formula language used in Power BI Desktop for creating custom calculations and measures. It allows you to perform complex calculations and analysis on your data model, similar to Excel formulas. 6. Query Editor: The Query Editor in Power BI Desktop provides a user-friendly interface for shaping and transforming your data before it's loaded into the data model. You can perform tasks like splitting columns, removing duplicates, and applying transformations easily. 7. Data Visualization: Power BI Desktop offers a wide range of visualization options to represent your data effectively. You can customize the appearance of visualizations, apply filters, drill down into details, and create interactive dashboards. Power BI Training Course in Hyderabad 8. Publishing and Sharing: Once you've created your reports and dashboards in Power BI Desktop, you can publish them to the Power BI service for sharing and collaboration. This allows users to access the reports online, interact with the data, and collaborate with colleagues in real-time. 9. Data Refresh: Power BI Desktop allows you to schedule data refreshes to keep your reports and dashboards up-to-date with the latest data from your sources.
You can configure automatic refreshes based on a schedule or trigger them manually. 10. Integration with Other Tools: Power BI Desktop seamlessly integrates with other Microsoft products and services such as Excel, Azure, and SharePoint, providing a comprehensive ecosystem for data analysis and visualization. Visualpath is the Leading and Best Institute for learning Power BI Training in Ameerpet, Hyderabad. We provide Power BI Training Course in Hyderabad and you will get the best course at an affordable cost. Attend a Free DemoCall at - +91-9989971070. Visit: https://visualpath.in/powerbi-training.html