Download
1 / 74
740 likes | 895 Vues
Dynamic Energy Budget theory. 1 Basic Concepts 2 Standard DEB model 3 Metabolism 4 Univariate DEB models 5 Multivariate DEB models 6 Effects of compounds 7 Extensions of DEB models 8 Co-variation of par values 9 Living together 10 Evolution 11 Evaluation.

E N D
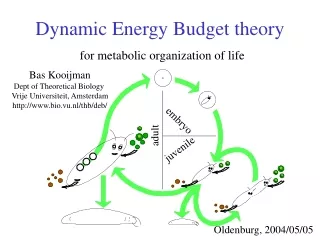
Dynamic Energy Budget theory 1 Basic Concepts 2 Standard DEB model 3 Metabolism 4 Univariate DEB models 5 Multivariate DEB models 6 Effects of compounds 7 Extensions of DEB models 8 Co-variation of par values 9 Living together 10 Evolution 11 Evaluation
Hazard rate 6.1 Definition: instantaneous death rate (dim: time-1) Interpretation of hazard rate times time increment: probability of death, given to be alive Relationship with survival probability for : Examples for :
Independent causes of death 6.1a If causes of death by events 0 are independent of that by events 1 then hazard rate add and survival probabilities multiply Example of application: death by background mortality and by toxicant in short bioassays: background mortality is accidental which means that the hazard rate is constant
Many factors contribute to hazard 6.1b • genetic factors (apoptosis) • starvation (diet deficiencies, type II diabetes) • environmental factors (physical, chemical, toxicants) • pathogens (disease) • accidents (predation) • aging
Free radicals Aging 6.1c • Aging results from damage by Reactive Oxygen Species (ROS) Gerschman 1954 • link with DEB model via dioxygen consumption & metabolic activity • Aging is binary in unicellulars, and gradual in multicellulars • age-affected cells no longer divide • Typical aging only occurs in multicellulars with irreversible cell differentiation • that have post-mitotic tissues • Induction of damage inducing compounds dioxygen consumption • contribution from assimilation is not included • because of more local occurrence in organism • Empirical evidence points to acceleration of aging • Damage inducing compounds generate • damage inducing compounds • damage compounds; hazard rate density of damage compounds • Some chemical compounds (e.g. RNS) and -radiation can stimulate aging
energetics Free radicals and ageing 6.1d feeding growth Respiration free radicals (internally generated) maintenance Oxidative damage tumour induction survival
-Radiation ROS Aging 6.1e Deinococcus radiodurans (Deinobacteria, Hadobacteria) Very resistant against -radiation by accumulation of Mn2+ which neutralizes ROS that is formed One cell from a tetrad
Amplification mechanisms 6.1f 1) Affected mitochondria produce more ROS Weindruch R 1996 Caloric restriction and aging. Scientific American 231, 46-52. 2) Affected mitochondria grow and degrade at different rates • Kowald A 2001 The mitochondrial theory of aging, Biological Signals & Receptors 10, 162-175. • Kowald A & Kirkwood TBL 2000 Accumulation of defective mitochondria through delayed degradation of damaged organelles and its possible role in the aging of post-mitotic cells. Journal of Theoretical Biology 202, 145-160.
Aging: relation to O2-use 6.1h, 7.8.1 survival prob Reodruction rate, #/d 0.374 high food 10/20°C high food 10/10°C low food 10/20°C 0.547 0.630 time, d time, d Survival in adult Notiophilus biguttatus modified by food and temperature Differences in life span are caused by differences in respiration Data: Ernsting & Isaaks 1997
Aging: sex differentiation 6.1i survival prob body weight, g time, d time, d Differences in aging between sexes are caused by differences in g Data on Daphnia magna: MacArthur & Baillie 1929
Food intake is constant 6.1j in laboratory rodents Probably as a result of experimental conditions males females males females Carcinogenicity study with B[a]P in rats Kroese et al., (2001) RIVM technical report nr. 658603 010
Aging: endotherms & feeding 6.1k Feeding level: 1, 0.75, 0.44 times ad libitum Caloric restriction extends life span weight, g srvivors, % time, d time, d Data: Weindruch et al, 1986 specific metabolic rate Van Leeuwen et al 2002 A mathematical model that accounts for the caloric restriction on body weight and longivety Biogerontology3: 373-381
Aging: endotherms & feeding 6.1l feeding level 1 body weight, g embryo weight, g 0.75 0.44 time, d time, d 0.44 survival probability • Life span • hardly depends on food in ecotherms • decreases for increasing food in endotherms 0.75 1 time, d Mus musculus data: Weindruch et al 1986, MacDowell et al 1927 Van Leeuwen et al 2002 Biogerontology3: 373-381
Aging & Energetics 6.1m Olm Proteus anguinus: a† > 100 a ab = 140 d, ap = 14 a, R = 35/12.5 a-1 Can live 10 months without food, so can switch to torpor state Voituron et al 2010 Biol. Lett.
Aging: non-growing ectotherms 6.1.1b Weibull with shape parameter 3 survival probability Data: Rose 1984 time, d
General Weibull fits DEB 6.1.1c • Both models are fitted to the same data • They fit equally well and have both 4 parameters • Contrary to the Weibull model the DEB model • is based on tested assumptions • has links with energetics via hW and hG. Data from Elandt-Johnson & Johnson 1980 for white USA males in the period 1969-1971
Aging: growing ectotherms 6.1.1d survival prob body weight, g time, d time, d Weibull with shape 3 fits ectothermic survival well, even if growth period not small relative to life span Data: Slob & Janse 1988
Aging: Function 6.1.3 • Observation: • Aging related hazard rate • remains low during embryonic and juvenile stages • becomes high at start of reproduction • Suggestion: • Organisms • decrease protection level in adult stage • use ROS to create genetic diversity among gametes • use genetic diversity for adaptation to changing environment • efficient defence (peroxidase dismutase) or repair systems • or reduced ROS production can increase life span, • but reduce genome diversity
Biology based methods 6.2 Effects based on internal concentrations One compartment accumulation-elimination Hazard rate or physiological target parameter is linear in internal concentration (small effects only) Dynamic Energy Budget theory is used to identify potential target parameters translate change in parameter to change in endpoint Interaction of compounds in mixture product of internal concentrations similar to analysis of variance
Kinetics 6.3 Simplest basis: one compartment kinetics • Correct for changes in • body size (growth) • lipid content (starvation) • concentration • (transformation)
n,n-compartment models 6.3a film model 1,1-comparment model Compound can cross, interface between media with different rates vice versa sub-layers with equal rates for all sublayers
1,1 compartment model 6.3b and Suppose while
Film models 6.3.2 Steady flux approximation
Dilution by growth 6.4.1 • Note: • elimination rate decreases with length of isomorph • exchange is across surface area • small changes in size already affect kinetics considerably
Dilution by growth 6.4.1a ke/rB Q(0) = c Q(0) = 0 ke/rB 10 10 2 2 1 1 ratio internal/external conc 0.5 0.5 0.1 0.1 trB trB scaled body length scaled reproduction rate ke elimination rate rB von Bert. growth rate
Change in lipid content 6.4.2 • Note: • biomass should be • decomposed into • reserve & structure • applies for slowly changing • food densities only
Satiating excretion kinetics 6.4.3 Elimination rate satiates as function of internal concentration Example: Removal of alcohol from blood by liver
Effects of environmental factors 6.5 • Process-based perspective on disturbances • temperature, chemicals, parasites, noise • exposure-time explicit methods (response surface) • Primary target: individuals • some effects at sub-organism level can be compensated (NEC) • Effects on populations derived from individuals • energy budget basic to population dynamics • Parameters of budget model individual specific • and (partly) under genetic control
Tasks of physiological module 6.5a • in the specification of toxic effects of chemicals • identify potential target parameters • for toxic effects (e.g. max feeding rate, • specific maintenance and growth costs) • specify interrelationships between • the various physiological processes • (e.g. feeding, maintenance, maturation, • growth, reproduction) • quantify how endpoints depend on • values of target parameters • (e.g. how does cumulative number of • offspring depend on the specific growth costs?)
Models for toxic effects 6.5b • Three model components: • kinetics • external concentration internal concentration • example: one-compartment kinetics • change in target parameter(s) • internal concentration value of target parameter(s) • example: linear relationship • physiology • value of parameter endpoint (survival, reproduction) • example: DEB model
Effects of parasites 6.5c Many parasites increase (chemical manipulation) harvest (all) allocation to dev./reprod. Results larger body size higher food intake reduced reproduction
assimilation maintenance costs defecation feeding food faeces growth costs assimilation reproduction costs reserve hazard to embryo somatic maintenance 7 maturity maintenance 1- maint tumour induction 6 maturation reproduction u endocr. disruption growth 7 lethal effects: hazard rate Mode of action affects translation to pop level 8 maturity offspring structure tumour 6 Modes of action of toxicants 6.5d
Modes of Action of Noise 6.5e • Effects on reproduction • blocking out fouraging time • reduction feeding efficiency • disrupting social behaviour • short/long term, partner choice • Effects on survival • problems with orientation (migration) • permanent hearing damage • interaction with large-scale fishing
Change in target parameter 6.5f Simplest basis: Change internal conc that exceeds internal NEC or with • Rationale • approximation • for small effects • effective molecules • operate independently
Effect Concentration 6.5g ECx(t): Concentration that gives x% effect at exposure time t, compared to the blank LCx(t) = ECx(t) in the case the endpoint is the survival probability (LC = lethal concentration) Generally: ECx(t) decreases in time the pattern depends on the properties of the chemical and of the test organism NEC = EC0()
Concentration ranges of chemicals 6.5.1 • too little • def: variations in concentration come with variations in effects • enough • def: variations in concentration within this range hardly affect • physiological behaviour of individuals • too much • def: variations in concentration come with variations in effects • e.g. water concentration can be too much even for fish • no basic difference between toxic and non-toxic chemicals • “too little” and “enough” can have zero range for some chemicals • Implication: lower & upper NEC for each compound
Contr. NOEC * LOEC NOEC 6.5.1a Statistical testing Response NOEC No Observed Effect Concentration LOEC Lowest Observed Effect Concentration log concentration
What’s wrong with NOEC? 6.5.1b • Power of the test is not known • No statistically significant effect is not no effect; • Effect at NOEC regularly 10-34%, up to >50% • Inefficient use of data • only last time point, only lowest doses • for non-parametric tests also values discarded OECD Braunschweig meeting 1996: NOEC is inappropriate and should be phased out!
Do No Effect Concentrations exist? 6.5.1c • Essential aspect: compensation at individual level • Each molecule of any compound has an effect at the molecular level • These effects do not necessarily translate into • measurable effects at the individual level • Example: removal of a kidney in a healthy human body does not • result in health effects under conditions that are not extreme • NEC is specific for • species and chemical compound • endpoint (survival, reproduction) • one process (maintenance, reproduction, ..) is most sensitive • experimental/environmental conditions
crossing must not be possible survival prob log conc Assumptions of standard approach 6.5.3 Lethal effects: • Individuals have identical toxico-kinetics • They die for sure if internal conc exceeds threshold • Threshold varies among individuals (log-logistic distribution) Empirical counter-evidence: • Slope conc-response curve becomes steeper during exposure • LC50 of re-exposed cohort remains the same • Sublethal effects don’t support large differences among individuals Kooijman (1996) An alternative for NOEC exists, but the standard model has to be replaced first. Oikos75: 310--316
too similar rarely significant Kooijman 1981 Water Res15:107-119 survival prob EC0 log conc Problems of standard approach 6.5.3a • Incorporation of exposure time is problematic (translation from acute to chronic effects; links to pharmacology) • Not applicable in case of varying exposure (peak exposure) • EC-small levels difficult to determine and model-sensitive (links to envir risk assessment) • Incompatible with NOEC/NEC NEC = EC0(∞) • Difficult to extrapolate from individual to population from one species to another, one chemical to another • Problems in quantifying effects of mixtures
Fast kinetics 6.5.3c Effects on survival at instantaneous equilibrium effect on survival concentration exposure time well known in pharmacology, desinfection of buildings, green houses
Effect on survival 6.5.3e Effects of Dieldrin on survival of Poecilia killing rate 0.038 l g-1 d-1 elimination rate 0.712 d-1 NEC 4.49 g l-1
Effect on assimilation 6.5.4 weight1/3, mg1/3 time, d CuCl2 mg/kg Data from Klok & de Roos 1996 NEC = 4.45 mg CuCl2 /kg on Lumbricus rubellus
200 65 180 60 160 55 140 50 120 45 cumulative offspring per female 100 body length 40 80 35 60 30 40 25 20 20 0 0 5 10 15 20 15 0 5 10 15 20 25 30 time time Decrease in assimilation 6.5.4asomatic maint coeff = maturity maint coeff Acrobeloides nanus Pentachlorobenzene Data: Alda Álvarez et al (2006) Fit: Jager
indirect effects mg kg-1 Effects on growth 6.5.4b 0, 0, 64,139 300 646 body length, mm 1392 Triphenyltin on Folsomia candida at 20°C 3000 assimilation direct effects body length, mm maintenance growth time, d time, d
TPT body length cumulative offspring time time Increase in maintenance costs 6.5.4c Folsomia candida Tri-Phenyl-Tin Jager et al. (2004)