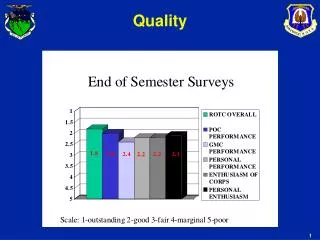
Quality
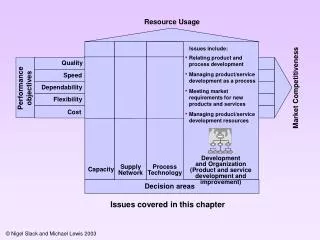
Quality. Chapter 20. Quality Control. Statistical and mathematical techniques Sampling tables Process control charts. Quality movements. Cost of Quality Zero-defect Programs Reliability Engineering Total Quality Control (also Total Quality Management). What is quality?.

Quality
E N D
Presentation Transcript
Quality Chapter 20
Quality Control • Statistical and mathematical techniques • Sampling tables • Process control charts
Quality movements • Cost of Quality • Zero-defect Programs • Reliability Engineering • Total Quality Control (also Total Quality Management)
What is quality? • Deming: continuous improvement • Juran: Fitness for use • Crosby: conformance to requirements
Application • Deming: manufacturing • Juran: Technology • Crosby: People-driven
Target Audience • Deming: Workers • Juran: Management • Crosby: Workers
ISO 9000 • ISO 9000 defines key terms and acts as a road map for other standards • ISO 9001 defines the model for a quality system when a contractor demonstrates the ability to design, produce, and install. • ISO 9002 quality system model for final inspection and testing • Quality management guidelines.
Quality Policy • Principles stating what, not how • Promote consistency • Tell outsiders how organization views quality • Specific guidelines for quality matters • Provisions for changing the policy
Quality objectives • Obtainable • Define specific goals • Understandable • Specific deadlines
Quality Assurance System • Identify objectives and standards • Multifunctional and prevention-oriented • Plan for collection and use of data in continuous improvement cycle • Plan for establishment and maintenance of performance measures • Include quality audits
Quality Control • What to control • Standards for corrective action • Measurement methods • Compare actual results to standards • Correct non-conforming processes • Monitor and calibrate measurement tools • Include detailed documentation of processes
Quality Audit • Ensures that quality standards will be met • Products are safe and fit for use • Laws and regulations were followed • Data collection and distribution systems are adequate and accurate • Corrective action taken when needed • Identify improvement opportunities
Quality Plan • Identify all internal and external customers • Cause design process and produces what the customer wants • Bring suppliers in early in the process • Cause organization to be responsive to changes in customer needs • Prove that the process works
Cost of Quality • Prevention costs • Appraisal costs • Internal failure costs • External failure costs
Seven Quality Control Tools • Data Tables • Cause-and-Effect Analysis • Histogram • Pareto Analysis • Scatter Diagrams • Trend Analysis • Control Charts
Cause-and-Effect Diagrams • Identify the problem • Select brainstorming team • Draw problem box and prime arrow • Specify major categories • Identify defect causes • Random, systematic, or process anlysis • Identify corrective action
Pareto Analysis • Histogram to help identify and categorize problem areas • Basic Pareto identifies few contributors to most problems (80/20 rule) • Comparative focuses on any number of program options or actions • Weighted gives a measure of significance to factors that may not seem significant at first: cost, time, criticality
Scatter Diagrams and Trends • Show data points against two axes, usually some measure against time • Can identify trends, such as bad parts increasing over time
Control Charts • Focus on prevention of defects • Determine whether process variability and average are at stable levels. • That is, whether inherent variability is random or due to a discernable cause.
Process Capability • Ability to produce a product that conforms to design specs
Acceptance Sampling • Single sampling • Double sampling • Multiple sampling • Producer’s risk • Consumer’s risk
Six Sigma • 2 defective parts per billion • Conversion table really gives 3.4 defects per million opportunities (From Schwalbe book, P. 327)
Quality Circles • Groups that meet to resolve quality problems • Team effort • Voluntary • Employees are trained • Management listens to recommendations
The Seven Wastes • Overproduction • Waiting • Transportation • Processing • Stocks • Motion • Defective products
Total Quality Management • Solicit ideas from employees • Develop teams to identify and solve problems • Team development for performing operations and service activities • Benchmark every major activity • Use process management methods to improve customer service