Download
1 / 29
290 likes | 432 Vues
Water Transport in Jet Stream Winds. Surface Water Hydrology Term Project Cédric DAVID. Overview. 1. Introduction 2. Data and Programming 3. Results 4. Conclusions. 1. Introduction. 1. Introduction. Upper level of the atmosphere. Wind. View from the North Pole. Jet Stream.

E N D
Water Transport in Jet Stream Winds Surface Water Hydrology Term Project Cédric DAVID
Overview • 1. Introduction • 2. Data and Programming • 3. Results • 4. Conclusions
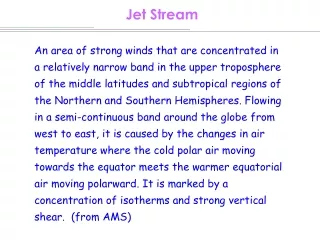
1. Introduction Upper level of the atmosphere Wind View from the North Pole Jet Stream
1. Introduction What happens? • Upper air winds regulate air masses • Their deflection by the Coriolis acceleration creates Jet Streams
1. Introduction Wind
1. Introduction Altitude: 10000m Wind Altitude: 13000m
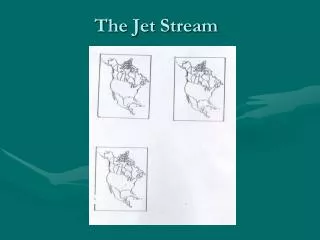
1. Introduction Jet Stream • Its position denotes strongest SURFACE temperature contrast • 100 – 300 km/h28 – 80 m/s • Weaker in the summer (smaller T gradient) In the US
1. Introduction Jet Streak • 300 km/h • Jet streaks are localized regions of very fast winds embedded within the jet stream.
2. Data and Programming IDV SoftwareJava-based software framework for analyzing and visualizing geoscience data
2. Data and Programming • National Oceanic and Atmospheric Administration • National Center for Environmental Prediction • National Weather Service North American Regional Reanalysis
2. Data and Programming NARR A Monthly • Pressure • Temperature • Specific Humidity • Wind Speed • Dew Point Temperature
2. Data and Programming • NARR.xml ( Too Long) • NARR Homepage (Download .grb grid files) • FTP server • Choose the desired options (levels, parameters and sub regions) • Open them with (degrib, Climate Data Operator, finally IDV)
2. Data and Programming Formulas in IDV Jython programming language Java version of Python can work with VisAD objects directly (no loop on the grid necessary) ws=sqrt(u2+v2)
3. Results Jet Streak Cross section with filtered Jet Stream Whole NARR Domain Long Computation time
July 3. Results 29 m/s isovolume Just above the Great Lakes
July 3. Results 12000m
July 3. Results
December 3. Results 29 m/s isovolume Just above Florida GOES SOUTH!
December 3. Results 12000m
December 3. Results
3. Results Jython formulas • Select Jet Stream • Specific Humidity Flow in Jet Stream
3. Results Jython formulas • Total Pressure p(not in the NARR) • Density of vapor rv • Mass of water
4. Conclusions • Limitation of Jython: • only basic mathematical computation • cannot access single cell (easily) • IDV • Good graphic interface • Calculations and formulas • Power of IDV and NARR • Visual aspect of the results • Able to show known phenomena
Questions? • http://www.physicalgeography.net/fundamentals/7q.html • http://ww2010.atmos.uiuc.edu/(Gh)/guides/mtr/cyc/upa/jet.rxml