Download
1 / 61
640 likes | 873 Vues
DNA Reaction Networks Fueled by Strand Displacement. Hieu Bui November 6 th , 2012. Outline. Winfree's Seesaw Gates Yurke's DNA Catalytic Cascades Zhang's DNA Reaction Networks Zhang’s Allosteric DNA Catalytic Reactions Zhang’s DNA Catalytic Reactions

E N D
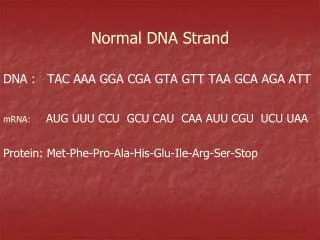
DNA Reaction Networks Fueled by Strand Displacement Hieu Bui November 6th, 2012
Outline • Winfree's Seesaw Gates • Yurke's DNA Catalytic Cascades • Zhang's DNA Reaction Networks • Zhang’s Allosteric DNA Catalytic Reactions • Zhang’s DNA Catalytic Reactions • Soloveichik's DNA Chemical Kinetics • Cardelli's DNA Strand Algebracuits
Qian L , Winfree E J. R. Soc. Interface doi:10.1098/rsif.2010.0729 Seesaw Gates The DNA motif for ‘seesaw’ gates. (a) Abstract gate diagram. Red numbers indicate initial concentrations. (b) The DNA gate motif and reaction mechanism. S1, S2, S3 and S4 are the recognition domains; T is the toehold domain; T′ is the Watson–Crick complement of T, etc. Arrowheads mark the 3′ ends of strands. Signal strands are named by their domains from 3′ to 5′, i.e. from left to right, so the input is S1TS2; gate base strands and threshold bottom strands are named by their domain from 5′ to 3′. All reactions are reversible and unbiased; solid lines indicate the dominant flows for the initial concentrations shown in (a), while the reverse reactions are dotted. (c) The threshold motif and reaction mechanism. The toehold is extended by a few bases (s′1, the complement of the first few 5′ bases of S1), providing an increased rate constant relative to the gate itself. Branch migration intermediate states are omitted from the diagram. (d) Example sequences. Gate complexes and signal molecules are shown at the domain level (second column) and at the sequence level (third column). Here, recognition domain sequences are 15 nt, the toehold domain sequence is 5 nt, and the toehold is extended by 3 nt for the threshold. Other lengths are possible, so long as they ensure that recognition domains will not spontaneously dissociate, toehold exchange is fast, and thresholding is sufficiently faster.
Qian L , Winfree E J. R. Soc. Interface doi:10.1098/rsif.2010.0729 Seesaw Gates Abstract diagrams for seesaw gate circuits. (a) The general form of a gate node. Each gate i may be connected to many wires on each side, potentially all N nodes in the network, including itself. For each wire from the right side of gate i to the left side of gate j, the initial concentration of the free signal wi,j may be written above the wire, and the initial concentrations of gate complex gj,i:i (wj,i bound to gate i) and gi:i,j (wi,j bound to gate i) may be written within the node at the ends of the corresponding wires. Gate concentrations are simply omitted if they are zero. Initial concentrations of thj,i:i (the threshold for wj,i arriving at gate i) and thi:i,j (the threshold for wi,j arriving at gate i) may be written in the same locations as gj,i:i and gi:i,j, respectively, but as negative numbers—or omitted if they are zero. (b) The general form of a wire. Each wire is specifically connected on its left end to the right side of a gate node, and connected on its right end to the left side of a gate node. (c) An example circuit with five realized gates (numbered circles), five virtual gates (numbers at ends of wires), and 11 wires. Each wire is identified by the two gates it connects; thus the virtual gates serve to provide full names (and sequences) to their incident wires. Note that circuit diagrams may be drawn without providing gate numbers, as they are not relevant to circuit function.
Qian L , Winfree E J. R. Soc. Interface doi:10.1098/rsif.2010.0729 Seesaw Gates Circuit diagrams and input/output behaviour of boolean logic gates. Output wires with arrowheads indicate that a downstream load is assumed, which consumes signal strands as they are released. (a−b) A two-input OR gate and a two-input AND gate using, respectively, 1 and 4 seesaw gates, the ‘1-4 scheme’. Circuits constructed using the 1-4 scheme are not clean, and thus would perform worse if threshold crosstalk and threshold inhibition were modelled. (c–d) A two-input OR gate and a two-input AND gate using two seesaw gates each, the ‘2-2 scheme’. Circuits constructed using the 2-2
Qian L , Winfree E J. R. Soc. Interface doi:10.1098/rsif.2010.0729 Seesaw Gates Compiling boolean logic circuits. (a) A sample circuit with six gates. (b) Translation into an equivalent dual-rail circuit with 12 gates. (c,d) Translation into an equivalent seesaw gate circuit with 32 gates (1-4 scheme) and 26 gates (2-2 scheme). (e,f) Simulation results for all 32 possible input vectors in the 1-4 scheme and in the 2-2 scheme. The concentrations of all four dual-rail output species are shown as a function of time. Delays vary with the input, depending the shortest decision path through the network. Simulations were run using the concentration 1x = 50 nM, with ON inputs at 0.9x and OFF inputs at 0.1x. For the 1-4 scheme, the simulated reaction equations were augmented to also model threshold crosstalk, which degrades the performance of OR gates—but the system still works.
Qian L , Winfree E J. R. Soc. Interface doi:10.1098/rsif.2010.0729 Seesaw Gates A 74L85 standard 4-bit magnitude comparator (four layers deep) and its seesaw circuit simulation, with 1x = 50 nM. (a) The digital logic circuit diagram. The corresponding seesaw circuit has roughly 100 seesaw gates. (b) Seesaw circuit simulation with selected input vector of A greater than B. (c) Seesaw circuit simulation with selected input vector of A smaller than B. (d) Seesaw circuit simulation with selected input vector of A equal to B.
Qian L , Winfree E J. R. Soc. Interface doi:10.1098/rsif.2010.0729 Seesaw Gates Implementation of relay circuits. (a) A simple circuit with current source (battery) and controlled device (denoted by a resistor), the corresponding seesaw gate circuit, and its simulation using 1x = 50 nM. Shaded and unshaded sides of seesaw gates assist checking that a wire always connects different sides of two seesaw gates as required by node polarity, i.e. each wire connects the shaded side of one seesaw gate to the unshaded side of another. Switching signal A is provided at 1x if ON, or else 0.1x if OFF. Input current signal was provided at 10x; to verify that no output signal is produced when the current input is OFF, a 1x signal was provided. (b) AND logic. (c) OR logic. (d) A more complex circuit. Overlapping trajectories (orange and light blue) were shifted to the left by 100 s to make them visible. (e) Switching signal fan-out, current signal fan-out and current signal fan-in.
Qian L , Winfree E J. R. Soc. Interface doi:10.1098/rsif.2010.0729 Seesaw Gates Analogue time-domain circuits. (a) A catalytic cascade that exhibits initially quadratic growth, with α ≈ 125 h−2. Temporal trajectories are shown for a series of exponentially decreasing initial input concentrations. (b) A positive feedback circuit that exhibits initially exponential growth, with β ≈ 17 h−1. The same series of exponentially decreasing input concentrations now yields a series of trajectories with linearly increasing half-completion times. (c) A pulse-generating circuit. Pulse amplitude depends on the input concentration. Here, we use a linear series of input concentrations between 0x and 1x. All simulations use 1x = 50 nM.
Qian L , Winfree E J. R. Soc. Interface doi:10.1098/rsif.2010.0729 Seesaw Gates Parallel preparation of seesaw gates as hairpin precursors. Using DNA microarray synthesis technologies, each gate, threshold and fuel is made as a single strand. After cleavage from the surface, the mixture is annealed to form hairpins. Restriction enzymes then cleave the hairpins to form gate and threshold complexes. Relative concentrations (red numbers) are set based on the number of DNA chip spots dedicated to a given strand; in this example, one spot produces 0.25x.
Bernard Yurke, Catalytic DNA Systems, DNATEC09, 2009 DNA Catalytic Cascades
Bernard Yurke, Catalytic DNA Systems, DNATEC09, 2009 DNA Catalytic Cascades
Bernard Yurke, Catalytic DNA Systems, DNATEC09, 2009 DNA Catalytic Cascades
Bernard Yurke, Catalytic DNA Systems, DNATEC09, 2009 DNA Catalytic Cascades
Bernard Yurke, Catalytic DNA Systems, DNATEC09, 2009 DNA Catalytic Cascades
Bernard Yurke, Catalytic DNA Systems, DNATEC09, 2009 DNA Catalytic Cascades
Bernard Yurke, Catalytic DNA Systems, DNATEC09, 2009 DNA Catalytic Cascades
Bernard Yurke, Catalytic DNA Systems, DNATEC09, 2009 DNA Catalytic Cascades
Bernard Yurke, Catalytic DNA Systems, DNATEC09, 2009 DNA Catalytic Cascades
Bernard Yurke, Catalytic DNA Systems, DNATEC09, 2009 DNA Catalytic Cascades
Bernard Yurke, Catalytic DNA Systems, DNATEC09, 2009 DNA Catalytic Cascades
Bernard Yurke, Catalytic DNA Systems, DNATEC09, 2009 DNA Catalytic Cascades
Bernard Yurke, Catalytic DNA Systems, DNATEC09, 2009 DNA Catalytic Cascades
Zhang et al Science 2007, 318 (16), 1121 DNA Reaction Networks 1 4 2 5 6 3
Zhang et al Science 2007, 318 (16), 1121 DNA Reaction Networks 1 4 k0=2.3 x 101 M-1 s-1 k1=6.5 x 10⁵ M-1 s-1 2 5 k3=4 x 10⁻³ s-1 k2=4.2 x 10⁵ M-1 s-1 6 3 krox=4 x 10⁵ M-1 s-1
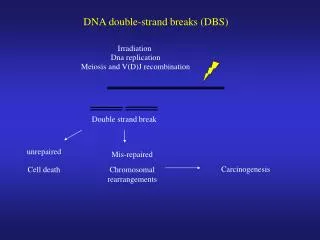
Zhang et al Science 2007, 318 (16), 1121 DNA Reaction Networks The entropy-driven reaction. (A) System components. Number labels denote functional domains, which are continuous stretches of DNA that act as units in binding. Domain x̄ is the complement of (and will hybridize to) domain x. (B) The proposed catalytic pathway. Reverse reactions are also present and modeled (with the exception of I5+OB→I4, which occurs at a negligible rate). (C) Analysis by PAGE (12% native gel) of the reaction mechanism. Unless otherwise noted, all experiments were performed at 25°C in tris-acetate (TE) buffer supplemented with 12.5 mM MgCl2. Here, [S] = [F] = 200 nM. [C] = 200 nM, except where C* denotes 20 nM. “ann.” denotes that species were annealed; “30 m” denotes that the reaction occurred for 30 min. See fig. S5 for the full gel, including control lanes. (D) Fluorescent reporter strategy. ROX denotes the carboxy-X-rhodaminefluorophore, and RQ denotes the Iowa Black Red Quencher. Domain 2 is subdivided into 2a, 2b, and 2c; 2ab consists of 2a and 2b (Table 1). (E) Demonstration of catalysis. Different amounts of C were introduced into the system at t ≈ 0. Here, [S] = 10 nM = 1×, [F] = 13 nM, and [OR] = 30 nM. Fluorescence (in all figures) is reported in units such that 0.0 is the background fluorescence of the quenched reporter and 1.0 is the fluorescence of ∼10 nM of triggered reporter. The control trace (black) shows the reaction with no substrate S and no catalyst C. Dotted lines show curves calculated with the reduced reaction model. sim, simulated.
Zhang et al Science 2007, 318 (16), 1121 DNA Reaction Networks A two-layer cascaded network. (A) Schematic. See table S2 for sequences of new domains. (B) Kinetics. Indicated amounts of initial catalyst C0 were added at t ≈ 0. Fluorescence derives from reporter complex OR (Fig. 1D) at 30 nM. Dotted lines show simulated traces; see SOM text S8 for details on reaction rates and modeling. a.u., arbitrary units. (Inset) Response to 0.0010×, 0.0003×, and 0.0001× catalyst. The asterisk indicates that three independent reaction traces are shown. 1.0 fluorescence units correspond to ≈ 10 nM of triggered reporter.
Allosteric DNA Catalytic Reactions D.Y. Zhang et al. JACS 2008, 130, 13921
Allosteric DNA Catalytic Reactions D.Y. Zhang et al. JACS 2008, 130, 13921
Allosteric DNA Catalytic Reactions D.Y. Zhang et al. JACS 2008, 130, 13921
Allosteric DNA Catalytic Reactions 10 bp 44 bp 3 x 10^3 /s 1.54 x 10^-5 /s 2 x 10^5 /M/s 22 bp 3 x 10^4 /M/s 30 bp 14 bp 16 bp D.Y. Zhang et al. JACS 2008, 130, 13921
Allosteric Enzymes http://resources.schoolscience.co.uk/unilever/16-18/proteins/protch6pg5.html
Zhang et al Nucleic Acids Research, 2010 doi:10.1093/nar/gkq088 DNA Catalytic Reactions
Zhang et al Nucleic Acids Research, 2010 doi:10.1093/nar/gkq088 DNA Catalytic Reactions
Zhang et al Nucleic Acids Research, 2010 doi:10.1093/nar/gkq088 DNA Catalytic Reactions
Zhang et al Nucleic Acids Research, 2010 doi:10.1093/nar/gkq088 DNA Catalytic Reactions
Zhang et al Nucleic Acids Research, 2010 doi:10.1093/nar/gkq088 DNA Catalytic Reactions
Zhang et al Nucleic Acids Research, 2010 doi:10.1093/nar/gkq088 DNA Catalytic Reactions
Zhang et al Nucleic Acids Research, 2010 doi:10.1093/nar/gkq088 DNA Catalytic Reactions
Zhang et al Nucleic Acids Research, 2010 doi:10.1093/nar/gkq088 DNA Catalytic Reactions
Zhang et al Nucleic Acids Research, 2010 doi:10.1093/nar/gkq088 DNA Catalytic Reactions
Soloveichik et al. PNAS 2010 doi: 10.1073/pnas.0909380107 DNA Chemical Kinetics
Soloveichik et al. PNAS 2010 doi: 10.1073/pnas.0909380107 DNA Chemical Kinetics
Soloveichik et al. PNAS 2010 doi: 10.1073/pnas.0909380107 DNA Chemical Kinetics
Soloveichik et al. PNAS 2010 doi: 10.1073/pnas.0909380107 DNA Chemical Kinetics
Luca Cardelli, Strand Algebras for DNA Computing, DNA 15 Conference, 2009 DNA Strand Algebracuits
Luca Cardelli, Strand Algebras for DNA Computing, DNA 15 Conference, 2009 DNA Strand Algebracuits
Luca Cardelli, Strand Algebras for DNA Computing, DNA 15 Conference, 2009 DNA Strand Algebracuits
Luca Cardelli, Strand Algebras for DNA Computing, DNA 15 Conference, 2009 DNA Strand Algebracuits
Luca Cardelli, Strand Algebras for DNA Computing, DNA 15 Conference, 2009 DNA Strand Algebracuits