1 / 2
30 likes | 58 Vues
Get this template plus 350 other premium business tools & templates at www.demandmetric.com

E N D
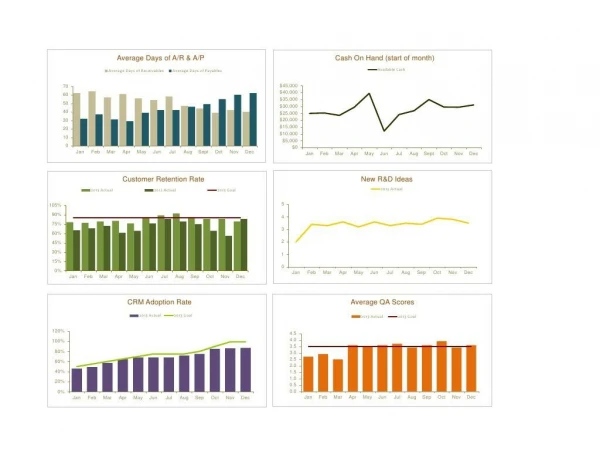
Business Strategy Metrics Dashboard Average Days of A/R & A/P Cash On Hand (start of month) Average Days of Receivables Average Days of Payables Available Cash 70 $45,000 60 $40,000 $35,000 50 $30,000 40 $25,000 30 $20,000 20 $15,000 $10,000 10 $5,000 0 $0 Jan Feb Mar Apr May Jun Jul Aug Sept Oct Nov Dec Jan Feb Mar Apr May Jun Jul Aug Sept Oct Nov Dec Customer Retention Rate New R&D Ideas 2013 Actual 2012 Actual 2013 Goal 2013 Actual105% 590% 475% 360%45% 230% 115% 0 0% Jan Feb Mar Apr May Jun Jul Aug Sep Oct Nov Dec Jan Feb Mar Apr May Jun Jul Aug Sep Oct Nov Dec CRM Adoption Rate Average QA Scores 2013 Actual 2013 Goal 2013 Actual 2013 Goal120% 4.5100% 4.0 3.5 80% 3.0 60% 2.5 2.0 40% 1.5 1.0 20% 0.5 0% 0.0 Jan Feb Mar Apr May Jun Jul Aug Sep Oct Nov Dec Jan Feb Mar Apr May Jun Jul Aug Sep Oct Nov Dec
Business Strategy Metrics Dashboard Business Strategy Metrics Q1 Q2 Q3 Q4Average Receivables/Payables Jan Feb Mar Apr May Jun Jul Aug Sept Oct Nov Dec Average Days of Receivables 62 64 57 61 56 54 58 47 44 39 42 40 Average Days of Payables 32 37 31 29 39 42 42 46 49 55 60 62Cash On Hand (start of month) Jan Feb Mar Apr May Jun Jul Aug Sept Oct Nov Dec Available Cash $24,903 $25,173 $23,449 $29,405 $39,505 $12,045 $24,053 $26,793 $34,953 $29,495 $29,405 $31,004Customer Retention Rate Jan Feb Mar Apr May Jun Jul Aug Sep Oct Nov Dec 2013 Actual 78.0% 77.0% 79.0% 80.0% 76.0% 84.0% 89.0% 92.0% 85.0% 83.0% 83.0% 79.0% 2013 Goal 85.0% 85.0% 85.0% 85.0% 85.0% 85.0% 85.0% 85.0% 85.0% 85.0% 85.0% 85.0% 2012 Actual 65.0% 68.0% 72.0% 61.0% 64.0% 76.0% 83.0% 79.0% 75.0% 64.0% 56.0% 83.0%New R&D Ideas (Voice of Customer) Jan Feb Mar Apr May Jun Jul Aug Sep Oct Nov Dec 2013 Actual 2 3 3 4 3 4 3 4 3 4 4 4CRM Adoption Rate Jan Feb Mar Apr May Jun Jul Aug Sep Oct Nov Dec 2013 Actual 46.0% 49.0% 57.0% 65.0% 68.0% 68.0% 68.0% 72.0% 75.0% 85.0% 86.0% 87.0% 2013 Goal 50.0% 55.0% 60.0% 65.0% 70.0% 75.0% 75.0% 75.0% 80.0% 90.0% 99.0% 99.0%Average QA Score Jan Feb Mar Apr May Jun Jul Aug Sep Oct Nov Dec 2013 Actual 3 3 3 4 4 4 4 3 4 4 3 4 2013 Goal 4 4 4 4 4 4 4 4 4 4 4 4 Business Strategy Metrics Dashboard Business Strategy Metrics Q1 Q2 Q3 Q4Average Receivables/Payables Jan Feb Mar Apr May Jun Jul Aug Sept Oct Nov Dec Average Days of Receivables 62 64 57 61 56 54 58 47 44 39 42 40 Average Days of Payables 32 37 31 29 39 42 42 46 49 55 60 62Cash On Hand (start of month) Jan Feb Mar Apr May Jun Jul Aug Sept Oct Nov Dec Available Cash $24,903 $25,173 $23,449 $29,405 $39,505 $12,045 $24,053 $26,793 $34,953 $29,495 $29,405 $31,004Customer Retention Rate Jan Feb Mar Apr May Jun Jul Aug Sep Oct Nov Dec 2013 Actual 78.0% 77.0% 79.0% 80.0% 76.0% 84.0% 89.0% 92.0% 85.0% 83.0% 83.0% 79.0% 2013 Goal 85.0% 85.0% 85.0% 85.0% 85.0% 85.0% 85.0% 85.0% 85.0% 85.0% 85.0% 85.0% 2012 Actual 65.0% 68.0% 72.0% 61.0% 64.0% 76.0% 83.0% 79.0% 75.0% 64.0% 56.0% 83.0%New R&D Ideas (Voice of Customer) Jan Feb Mar Apr May Jun Jul Aug Sep Oct Nov Dec 2013 Actual 2 3 3 4 3 4 3 4 3 4 4 4CRM Adoption Rate Jan Feb Mar Apr May Jun Jul Aug Sep Oct Nov Dec 2013 Actual 46.0% 49.0% 57.0% 65.0% 68.0% 68.0% 68.0% 72.0% 75.0% 85.0% 86.0% 87.0% 2013 Goal 50.0% 55.0% 60.0% 65.0% 70.0% 75.0% 75.0% 75.0% 80.0% 90.0% 99.0% 99.0%Average QA Score Jan Feb Mar Apr May Jun Jul Aug Sep Oct Nov Dec 2013 Actual 3 3 3 4 4 4 4 3 4 4 3 4 2013 Goal 4 4 4 4 4 4 4 4 4 4 4 4