Product Lifecycle Matrix (Boston Square)
30 likes | 152 Vues
Get this template plus 350 other premium business tools & templates at www.demandmetric.com

Product Lifecycle Matrix (Boston Square)
E N D
Presentation Transcript
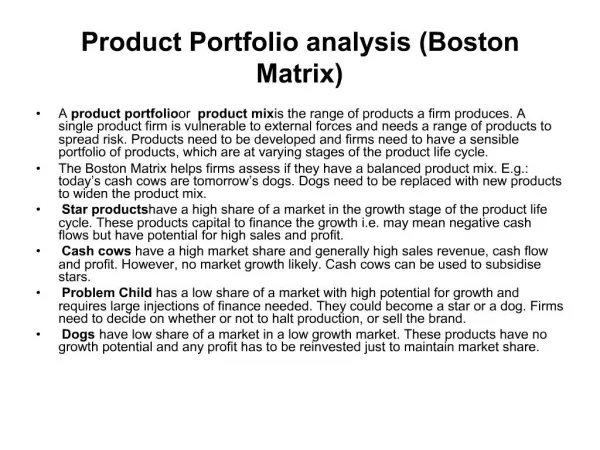
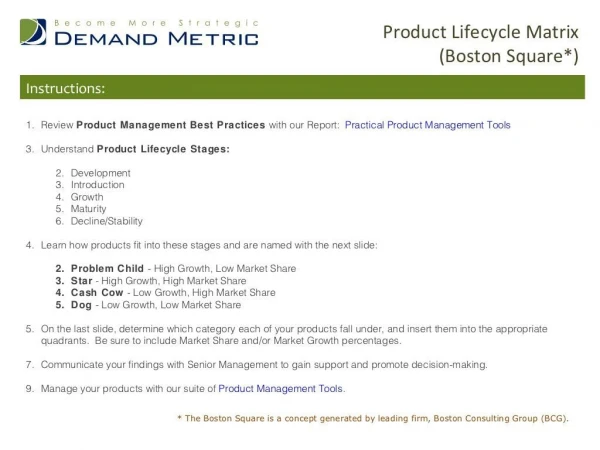
Product Lifecycle Matrix (Boston Square) Product Lifecycle Matrix (Boston Square*)Instructions:1. Review Product Management Best Practices with our Report: Practical Product Management Tools3. Understand Product Lifecycle Stages: 2. Development 3. Introduction 4. Growth 5. Maturity 6. Decline/Stability4. Learn how products fit into these stages and are named with the next slide: 2. Problem Child - High Growth, Low Market Share 3. Star - High Growth, High Market Share 4. Cash Cow - Low Growth, High Market Share 5. Dog - Low Growth, Low Market Share5. On the last slide, determine which category each of your products fall under, and insert them into the appropriate quadrants. Be sure to include Market Share and/or Market Growth percentages.7. Communicate your findings with Senior Management to gain support and promote decision-making.9. Manage your products with our suite of Product Management Tools. * The Boston Square is a concept generated by leading firm, Boston Consulting Group (BCG).
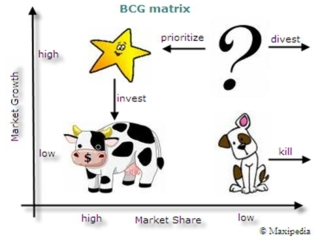
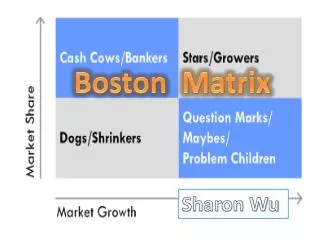
Product Lifecycle Matrix (Boston Square) High 1. Problem Child 2. Star • Products which demand high investment • Best Profit and Potential. for little short-term returns in revenue • May require investment to become • Initially funded by income from Cash Cows established as market leaders • Either become the next generation of Stars • New variants with high value-addedMarket Growth (eventually Cash Cows), or are abandoned features to increase market share 4. Dog 3. Cash Cow • Established products which produce cash • Obsolete products that don’t warrant any with minimal investment in time and/or further investment or development money • Market share has eroded by competition, • Cosmetic changes are used to maintain new developments, or customer needs market share against competitors • At the final stage of the Product Lifecycle • Goal is to extend period of cash generation for as long as possible Low Low High Market Share Product Lifecycle Matrix (Boston Square) High 1. Problem Child 2. Star • Products which demand high investment • Best Profit and Potential. for little short-term returns in revenue • May require investment to become • Initially funded by income from Cash Cows established as market leaders • Either become the next generation of Stars • New variants with high value-addedMarket Growth (eventually Cash Cows), or are abandoned features to increase market share 4. Dog 3. Cash Cow • Established products which produce cash • Obsolete products that don’t warrant any with minimal investment in time and/or further investment or development money • Market share has eroded by competition, • Cosmetic changes are used to maintain new developments, or customer needs market share against competitors • At the final stage of the Product Lifecycle • Goal is to extend period of cash generation for as long as possible Low Low High Market Share
Product Lifecycle Matrix (Boston Square) High 1. Problem Child 2. Star 1. Product 1 (Enter Market Growth %) 1. Product 1 (Enter Market Growth %) 3. Product 2 (Enter Market Growth %) 3. Product 2 (Enter Market Growth %) 5. Product 3 (Enter Market Growth %) 5. Product 3 (Enter Market Growth %)Market Growth 7. Product 4 (Enter Market Growth %) 7. Product 4 (Enter Market Growth %) 4. Dog 3. Cash Cow 1. Product 1 (Enter Market Share %) 1. Product 1 (Enter Market Share %) 3. Product 2 (Enter Market Share %) 3. Product 2 (Enter Market Share %) 5. Product 3 (Enter Market Share %) 5. Product 3 (Enter Market Share %) 7. Product 4 (Enter Market Share %) 7. Product 4 (Enter Market Share %) Low Low High Market Share Product Lifecycle Matrix (Boston Square) High 1. Problem Child 2. Star 1. Product 1 (Enter Market Growth %) 1. Product 1 (Enter Market Growth %) 3. Product 2 (Enter Market Growth %) 3. Product 2 (Enter Market Growth %) 5. Product 3 (Enter Market Growth %) 5. Product 3 (Enter Market Growth %)Market Growth 7. Product 4 (Enter Market Growth %) 7. Product 4 (Enter Market Growth %) 4. Dog 3. Cash Cow 1. Product 1 (Enter Market Share %) 1. Product 1 (Enter Market Share %) 3. Product 2 (Enter Market Share %) 3. Product 2 (Enter Market Share %) 5. Product 3 (Enter Market Share %) 5. Product 3 (Enter Market Share %) 7. Product 4 (Enter Market Share %) 7. Product 4 (Enter Market Share %) Low Low High Market Share