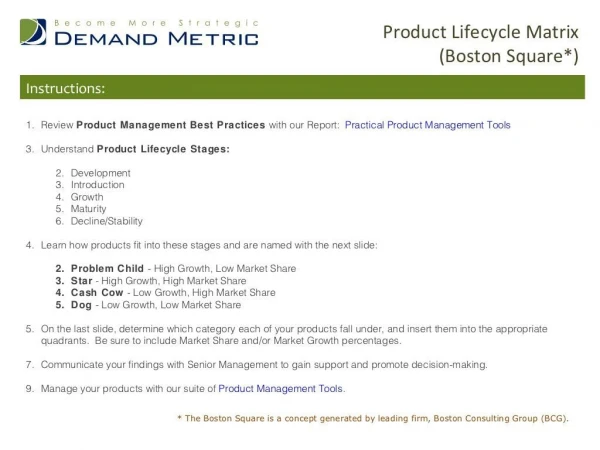
Boston Matrix
Boston Matrix. Boston Matrix is a tool of portfolio analysis 2. Not only it can portfolio a product which is produced by a firm, but also can portfolio a business. 3. Portfolio is the collection of businesses or products that make up a business. Function.

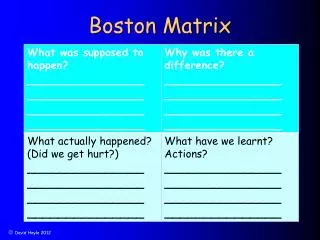
Boston Matrix
E N D
Presentation Transcript
Boston Matrix Boston Matrix is a tool of portfolio analysis 2. Not only it can portfolio a product which is produced by a firm, but also can portfolio a business. 3. Portfolio is the collection of businesses or products that make up a business.
Function Boston matrix is an useful tool to analysis the portfolio and collection of products. The Boston matrix’s ideal is balanced portfolio with some products in each category.
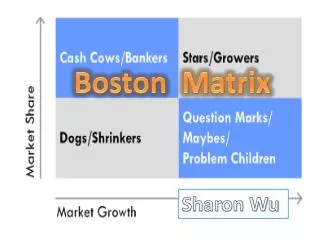
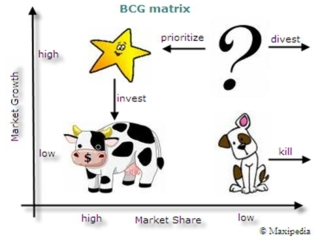
Summary Products are categorised as: Question marks: High market growth, low market share, cash absorbing. Stars: High market growth, high market share, cash neutral. Cash cows: Low market growth, high market share, cash generating. Dogs: Low market growth, low market share, cash neutral.
Problem child products High market growth, low market share cash absorbing. It has a potential but we can not sure if it will better future Probably it will become either a dog or a stars Example: diamond
Stars High market growth, high market share, cash neutral. The product usually is income. However, it is countered by high spending on marketing the product. Example: iphone, imac etc.
Cash cows Low market growth, high market share, cash generating . Little potential for growth Example: gold
Dogs Low market growth, low market share, cash neutral. No real potential Products that are in the decrease phase of their life circle. Example: Nokia
Advantage and Disadvantages There as also several problems to using the Boston Matrix. Often people assume that higher rates of profit are directly related to high rates of market share. This is not always the case. For example a product may come onto the market that gains a high market share quickly but there are still the very high development costs to cover first. Finally the main problem is that it over simplifies a complex decision so the Boston Matrix should only be used for planning.