Download

1 / 15
150 likes | 441 Vues
The Boston Matrix (Also called the BCG Matrix, the Growth-Share Matrix and Portfolio Analysis). Focusing effort to give the greatest returns. If you enjoy visual representations and vivid descriptions of your business then you'll love the Boston Matrix!

E N D
The Boston Matrix(Also called the BCG Matrix, the Growth-ShareMatrix and Portfolio Analysis)
Focusing effort to give the greatest returns • If you enjoy visual representations and vivid descriptions of your business then you'll love the Boston Matrix! • Also called the BCG Matrix, it provides a useful way of looking at the opportunities open to you, and helps you analyze which segments of your business are in a good position – and which ones aren’t. That way, you can decide on the most appropriate investment strategy for your business in the future, and where best to allocate your resources.
Understanding the Model • Market Share and Market Growth
To understand the Boston Matrix you need to understand how market share and market growth interrelate.Market share is the percentage of the total market that is being serviced by your company, measured either in revenue terms or unit volume terms. The higher your market share, the higher proportion of the market you control.The Boston Matrix assumes that if you enjoy a high market share you will normally be making money (this assumption is based on the idea that you will have been in the market long enough to have learned how to be profitable, and will be enjoying scale economies that give you an advantage). Understanding the Model
The question it asks is, "Should you be investing your resources into that product line just because it is making you money?" The answer is, "not necessarily."This is where market growth comes into play. Market growth is used as a measure of a market's attractiveness. Markets experiencing high growth are ones where the total market is expanding, which should provide the opportunity for businesses to make more money, even if their market share remains stable.By contrast, competition in low growth markets is often bitter, and while you might have high market share now, what will the situation look like in a few months or a few years? This makes low growth markets less attractive. Understanding the Model
Note:The origin of the Boston Matrix lies with the Boston Consulting Group in the early 1970s. It was devised as a clear and simple method for helping corporations decide which parts of their business they should allocate their available cash to. Today, this is as important as ever because of the limited availability of credit. However, the Boston Matrix is also a good tool for thinking about where to apply other finite resources: people, time and equipment. Understanding the Model
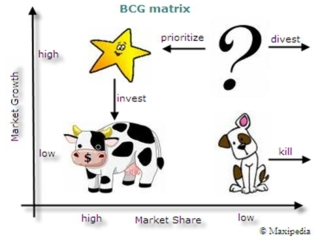
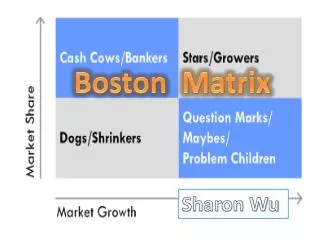
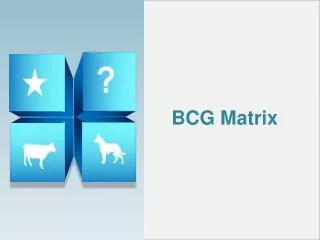
The Matrix Itself • The Boston Matrix categorizes opportunities into four groups, shown on axes of Market Growth and Market Share:
Dogs: Low Market Share / Low Market Growth • In these areas, your market presence is weak, so it's going to take a lot of hard work to get noticed. Also, you won't enjoy the scale economies of the larger players, so it's going to be difficult to make a profit.
Cash Cows:High Market Share / Low Market Growth • Here, you're well-established, so it's easy to get attention and exploit new opportunities. However it's only worth expending a certain amount of effort, because the market isn't growing and your opportunities are limited.
Stars:High Market Share / High Market Growth • Here you're well-established, and growth is exciting! These are fantastic opportunities, and you should work hard to realize them.
Question Marks (Problem Child):Low Market Share / High Market Growth • These are the opportunities no one knows what to do with. They aren't generating much revenue right now because you don't have a large market share. But, they are in high growth markets so the potential to make money is there.Question Marks might become Stars and eventual Cash Cows, but they could just as easily absorb effort with little return. These opportunities need serious thought as to whether increased investment is warranted.
How to Use The Tool: • To use the Boston Matrix to look at your opportunities, use the following steps:Step One: Plot your opportunities in terms of their relative market presence, and market growth on a blank matrix or a worksheet.Step Two: Classify them into one of the four categories. If a product seems to fall right on one of the lines, take a real hard look at the situation and rely on past performance to help you decide which side you will place it.
Step Three: Determine what you will do with each product/product line. There are typically four different strategies to apply:
Build Market Share: Make further investments (for example, to maintain Star status, or turn a Question Mark into a Star) • Hold: Maintain the status quo (do nothing) • Harvest: Reduce the investment (enjoy positive cash flow and maximize profits from a Star or Cash Cow) • Divest: For example, get rid of the Dogs, and use the capital to invest in Stars and some Question Marks.
Key Points • The Boston Matrix is an effective tool for quickly assessing the options open to you, both on a corporate and personal basis. • With its easily understood classification into "Dogs", "Cash Cows", "Question Marks" and "Stars", it helps you quickly and simply screen the opportunities open to you, and helps you think about how you can make the most of them.