Download

1 / 43
430 likes | 589 Vues
Statistical Modeling of Brain Imaging Data: An Overview, Challenges, and Future Directions. SAMSI Analysis of Object Data (AOOD) September 14, 2010 DuBois Bowman, Ph.D . Department of Biostatistics and Bioinformatics Center for Biomedical Imaging Statistics Emory University.

E N D
Statistical Modeling of Brain Imaging Data: An Overview, Challenges, and Future Directions SAMSI Analysis of Object Data (AOOD) September 14, 2010 DuBois Bowman, Ph.D. Department of Biostatistics and Bioinformatics Center for Biomedical Imaging Statistics Emory University
The Human Brain • Controls all body activities • Heart rate, breathing, sexual function • Motor activities and senses • Learning, memory, language • Emotion, mood, behavior • Daunting task for an organ that is • 3 pounds of fatty tissue • The size of 4 sheets of paper (cortex) Colin, Montreal Neurological Institute. Research Triangle Park, NC
The Human Brain • What enables this amazing functionality? • Signaling via a network of an estimated 100 billion neurons • Highly sophisticated organization • Each neuron has (on average) 7,000 synaptic connections, giving up to 700 trillion connections. [1 quadrillion at age 3] Research Triangle Park, NC
Acquisition • Popular functional neuroimaging methods measure correlates of blood flow and metabolism as a proxy for brain activity • Functional magnetic resonance imaging (fMRI) • Positron emission tomography (PET) Research Triangle Park, NC
The Human Brain • Brain imaging research: • Link behavior to brain function • Link alterations in “normal” brain function to addiction, psychiatric disorders, and neurologic disorders. • How treatments work • Mechanisms of action • Optimizing treatment selections Research Triangle Park, NC
Data: Scanning • Serial 3-D scans for each subject • Scans acquired under different experimental stimuli (tasks) • Hundreds of thousands of voxels • fMRI: S usually in the hundreds (PET: T<20) T Research Triangle Park, NC
Data:Study Designs • Block Designs: stimuli of the same condition grouped together in blocks. • Increased SNR, power, and robustness • Event-related Designs: arbitrary (random) presentation of stimuli • Avoids confounds due to habituation, anticipation, or strategy. Research Triangle Park, NC
Data Characteristics 1 1 T 1 V x T (#voxels) x (#meas. times) V Research Triangle Park, NC
Data Applications • Motor tasks • Face processing (memory) • Language processing • Pain processing • Psychiatric disorders (Depression, Schizophrenia, OCD, Social anxiety, etc.) • Psychopathy Research Triangle Park, NC
Data Example fMRI from Working Memory Task: • n=28 subjects • 15 schizophrenia patients • 13 healthy controls • 177 scans per session acquired during a working memory task (TR=2 sec) • Two sessions: • 24 hours - 3 weeks later Research Triangle Park, NC 10 10
Challenges • Massive amounts of data • Complex correlation structures • Temporal (scans/epochs/sessions) • Spatial • Multiplicity issues for inference • Number of voxel-pairs prohibits full voxel-level covariance modeling and network analyses Research Triangle Park, NC 11
Challenges Bowman (2007), JASA • Massive amounts of data • ≈ 319.5 million data points per subject! • ≈ 8.9 billion data points for all subjects!! • Complex correlation structures Research Triangle Park, NC 12
Challenges • Multiplicity issues for inference • 902,629 voxels • Statistical dependence between voxels • Number of voxel-pairs prohibits full voxel-level covariance modeling and network analyses • ≈ 45,263,000,000 voxel pairs Research Triangle Park, NC 13
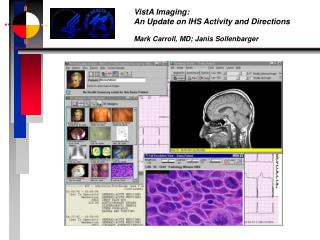
Pre-Processing Steps: Slice timing correction Motion correction Coregistration of functional and anatomical data Spatial normalization Spatial smoothing Temporal filtering Convolving the stimulus function and the HRF T2* EPI image (low resolution) T1 structural MR image (high resolution) Research Triangle Park, NC 14
Analysis Methods • Activation Analysis: • Changes between tasks, sessions, subgroups, etc. • Scale of localization • Voxel-level analyses • Region-level analyses • Network Analysis: • Partitioning methods • Functional connectivity (correlations) • Prediction: • Prediction for neural activity Research Triangle Park, NC
Statistical Methods Activation Analysis: Identifying localized alterations in brain activity
Methods: Activation • Two-Stage Linear Model: Stage I • Pre-coloring/temporal smoothing [Worsley and Friston, 1995] • Pre-whitening [Bullmore et al, 1996; Purdon and Weisskoff, 1998] • Alternative structures available for PET [Bowman and Kilts, 2003] Research Triangle Park, NC
Methods: Activation Stage II General Linear Model • Voxel-level test statistic maps • Threshold • Mutiple testing adjustment: FDR, RFT, Bonferonni, etc. Research Triangle Park, NC 18
Methods: Activation Stage II General Linear Model • Voxel-by-voxel analyses • Model assumes independence between brain activity measures at different brain locations Research Triangle Park, NC 19
Methods: Activation ρ1 ρ12 ρ2 ρ13 ρ23 ρ3 Spatial Models • Regional parcellation • Correlations • Within regions • Between regions • Inferences • Voxel level • Regional Research Triangle Park, NC 20
Methods: Activation Bowman et al., 2008, NeuroImage Stage II: Spatial Bayesian Hierarchical Model (SBHM) Research Triangle Park, NC 21
Methods: Activation Stage II Spatial BHM • Voxel and region-level posterior probability maps Research Triangle Park, NC
Methods: Activation Stage II Spatial BHM • (Spatial) Correlations between distinct brain locations (functional connectivity) Research Triangle Park, NC
Methods: Activation Alternative Approaches • Non-parametric methods • Permutation tests[Nichols and Holmes, 2002] • Wavelet-based resampling methods [Bullmore et al., 2004, among others] • Extended simultaneous autoregressive models [Derado et al., 2010] Research Triangle Park, NC 24
Statistical Methods Network Analysis: Identifying Associations in Brain Function
1 T ≈ + × + • • • • • • × Methods: Brain NetworksICA Temporal responses Observed fMRI data Spatial map Component 1 Component 2 Goal: Decompose observed fMRI data as a linear combination of spatio-temporal processes of underlying source signals. Figure: MELODIC at http://www.fmrib.ox.ac.uk/analysis/research/melodic/ Research Triangle Park, NC
Voxels 1 ………….. V A S E Time T …...1 … Methods: Brain NetworksICA Noise not explained by IC’s observed fMRI measurements Rows are statistically independent spatial source signals Mixing matrix; each colum is a latent time series associated with a specific source signal Research Triangle Park, NC 27
Methods: Brain NetworksGroupICA Spatial activation maps and time series of 3 selected ICs pall =0.054 pon =0.298 poff<0.001 pall=0.005 pon =0.044 poff<0.001 pall<.001 pon<.001 poff<.001 Research Triangle Park, NC 28
Methods: Brain Networks Clustering: New application of an old statistical method • Objective: Partition the brain into groups of voxels exhibiting similar function (temporal/spectral) within. • Based on distances between temporal profiles, e.g. [Bowman et al., 2004; Bowman and Patel, 2004] Research Triangle Park, NC 29
Methods: FC Clustering Illustration Research Triangle Park, NC 30
Methods: Brain Networks Courtesy of Indiana University Research Triangle Park, NC Whole-brain networks 31
Statistical Methods Prediction
Methods: Prediction Objective: • Predict neural activity based on functional brain images and other relevant subject information. Research Triangle Park, NC
Prediction Algorithm (a) prediction mean square error (PMSE) +12 +20 +32 +48 Characteristics (treatment group; …) Pre-treatment Post-treatment (b) coverage probabilities of prediction intervals +12 +20 +32 +48 1 Prediction Algorithm Model Building Training subjects … … … N Methods: Predicting neural activity Pre-treatment Neural activity Develop the prediction algorithm 1 Predicted Post-treatment Maps … 1 output input New subjects m … m Characteristics Apply the prediction algorithm 1 … m Source: Guo et al. 2008, Human Brain Mapping. Research Triangle Park, NC 34 Figure 2 Flow chart for the Bayesian hierarchical model. Symbols represent different roles in the model with diamonds for hyperparameters, ovals for primary parameters, octagons for error terms, rectangles for design matrices, and a rounded rectangle for observations/measurements. Black symbols represent components related to effects of interest for prediction and grey symbols represent components related to effects of no particular interest. The first stage of the hierarchy models brain activity measurements in terms of subject-specific parameters through design matrices containing scan-specific features, and the second stage models the subject-specific effects in terms of population parameters through design matrices containing subject characteristics. The population parameters are modulated by hyperparameters based on prior information. (a) pre- to post-treatment changes with olanzapine -18mm -6mm +6mm +18mm (b) pre- to post-treatment changes with risperidone -18mm -6mm +6mm +18mm c). comparing pre- to post-treatment changes between olanzapine and risperidone -18mm -6mm +6mm +18mm Figure 3 Thresholded posterior probability maps (PPM) for second-level treatment effects on pre- to post-treatment changes in rCBF based on the Bayesian hierarchical model for the working memory study. The axial slices shown are relative to the anterior commissure. (a) and (b) depict regions that show increase (yellow) or decrease (blue) in rCBF from pre- to post-treatment with posterior probability greater than 0.95 with each of the two treatments. In plot(c), yellow indicates the pre- to post-treatment difference is greater with olanzapine than with risperidone with posterior probability greater than 0.95 , i.e. Pr[(post-pre) olanzapine- (post-pre) risperidone >0]>0.95; blue indicates the pre- to post-treatment difference is greater with risperidone than olanzapine with posterior probability greater than 0.95 , i.e. Pr[ (post-pre) risperidone -(post-pre) olanzapine- >0]>0.95. Olanzapine results in decreased rCBF responses in more brain locations than risperidone. (a) Predicted post-treatment maps (b) Observed post-treatment maps Figure 4 Individualized predicted and observed post-treatment rCBF measurements under the low load condition for 4 subjects in the working memory study. The axial slice shown is -6mm below the anterior commissure. (a) predicted maps. Notable differences exist between the patients’ predicted brain responses to treatment. (b) observed maps. There is satisfactory agreement between the predicted and observed post-treatment rCBF. Subject 12 Subject 14 Figure 5 Predicted pre- to post-treatment alterations under the low load condition after treatment with olanzapine for subjects 12 and 14 in the working memory study. Subject 12 shows increased task-related activation in the occipital cortex but decreased activations in the medial prefrontal cortex. Subject 14 is predicted to have decreased activations in the occipital and temporal cortex, and inferior frontal cortex but increased activations in the left temporal cortex. (a) Bayesian hierarchical model (b) GLM Figure 6 Maps depicting the square root of the prediction mean square error (PMSE) divided by the average brain activity at each voxel for prediction of the post-treatment brain activity for the working memory study. The axial slices range from -18mm to +18 mm from the anterior commissure. (a) Bayesian hierarchical model. The square root of the PMSE generally falls below 10% of the average localized rCBF. The highest prediction error is observed in the areas of the brainstem, hippocampus, inferior frontal cortex, posterior cingulate cortex, and posterior parietal cortex. The prediction in the areas of medial prefrontal cortex and thalamus is fairly accurate where the error is no higher than 5% of the average activity. (b) GLM. Prediction errors based on the proposed Bayesian hierarchical model are 25% lower than those of the GLM on average and the superiority of our prediction model is consistently observed across the brain. Figure 7 Maps showing coverage probabilities of the 95% prediction intervals for predictions of post-treatment brain activity based on the Bayesian hierarchical model for the working memory study. The axial slices range from -18mm to +18 mm from the anterior commissure. Across all voxels, 91% of the observed post-treatment rCBF measurements fall within the 95% prediction intervals. The areas that show relatively low coverage probabilities include lateral orbitofrontal cortex, left temporal and occipital cortex. These areas also tend to have high ratio of PMSE in Figure 1(a). Figure 8 Maps showing the prediction error for predicting the post-treatment subject effects for the fMRI study of cocaine dependence. The axial slices range from +12mm to +48 mm from the anterior commissure. (a) the standardized square root of the prediction mean square error (PMSE). The standardized PMSE falls below 15% for the majority of voxels. The highest prediction error is observed in the areas of medial frontal cortex, superior frontal cortex, occipital cortex and superior parietal cortex. (b) coverage probabilities of the 95% prediction intervals. Across all voxels, 96% of the post-treatment subject effects estimated from the observed post-treatment fMRI data fall within the 95% prediction intervals.
Goal: predict the post-treatment rCBF or mean BOLD response. Use conditional dist. of post-trt. given pre-trt. where with Methods: Predicting neural activity Research Triangle Park, NC 35
Results: Cocaine dependence data Methods: Predicting neural activity (a)Ratio of prediction mean square error (PMSE) to average brain activity +12 +20 +32 +48 0.2 0.1 0.0 (b) Coverage probabilities of prediction intervals +12 +20 +32 +48 0.9 0.8 0.7 Research Triangle Park, NC 36
Future Directions • Multimodality imaging: integrate various types of imaging data with different • Temporal/frequency properties • Spatial properties • Inherent meanings (structure/function) • Examples • fMRI/EEG • fMRI/DTI • PET/MR Research Triangle Park, NC
Future Directions • Curve modeling (FDA) • Anesthesia/pain studies • Prediction: use 4-D data object (plus other patient information) to predict clinical response to treatment. • Unified spatio-temporal modeling • Causal relationships in neural activity • Drug intervention studies Research Triangle Park, NC
Software Resources • Statistical Parametric Mapping (SPM) • http://www.fil.ion.ucl.ac.uk/spm/ • FMRIB Software Library (FSL) • http://www.fmrib.ox.ac.uk/fsl/ • Analysis of Functional NeuroImages (AFNI) • http://afni.nimh.nih.gov/afni • BrainVoyager • http://www.brainvoyager.com/ • Group ICA of fMRI Toolbox (GIFT) • http://icatb.sourceforge.net • Free-surfer • http://surfer.nmr.mgh.harvard.edu/ • MRIcro/MRIcron • http://www.sph.sc.edu/comd/rorden/mricro.html • Center for Biomedical Imaging Statistics (CBIS) • http://www.sph.emory.edu/bios/CBIS/ Research Triangle Park, NC 40 40
Website: http://www.sph.emory.edu/bios/CBIS Amaro, E., Barker, G.J. (2006). Study design in MRI: Basic principles. Brain and Cognition 60:220-232. Beckmann, C.F., Smith, S.M., (2005). Tensorial extensions of independent component analysis for multisubject FMRI analysis. Neuroimage 25:294-311. Bowman, F. D., Caffo, B. A, Bassett, S., and Kilts, C. (2008). Bayesian Hierarchical Framework for Spatial Modeling of fMRI Data. NeuroImage 39:146-156. Bowman, F. D. (2007). Spatio-Temporal Models for Region of Interest Analyses of Functional Neuroimaging Data, Journal of the American Statistical Association 102(478): 442-453. Bowman, F. D. and Patel, R. (2004) Identifying spatial relationships in neural processing using a multiple classification approach. NeuroImage 23: 260-268. Bullmore, Fadili, Breakspear, Salvador, Suckling and Brammer (2003). Wavelets and statistical analysis of functional magnetic resonance images of the human brain. Statistical Methods in Medical Research 12(5):375-399. Calhoun, V.D., Adali, T., Pearlson, G.D., Pekar, J.J. (2001). A method for making group inferences from functional MRI data using independent component analysis. Human Brain Mapping 14:140-151. References Research Triangle Park, NC 41
Chen, S., Derado, G., Guo, Y., Bowman, F.D. (2009). Classification methods for identifying the neural characterics of antidepressanttreatment. Abstract. 15th Annual Meeting of the Organization for Human Brain Mapping, San Francisco, CA. Dale, A.M. (1999). Optimal experimental design for event-related fMRI. Human Brain Mapping 8:109-114. Friston, K.J., Harrison, L. and Penny, W. (2003). Dynamic causal modelling. Neuroimage 19(4):1273-302. Friston, K J; Frith, C D; Liddle, P F; Frackowiak, R S J. (1993). J Cereb Blood Flow Metab 13:5-14. Grafton, S.T., Sutton, J. Couldwell, W., et al. (1994). Network analysis of motor system connectivity in Parkinson’s disease: modulation of thalamocortical interactions after pallidotomy. Human Brain Mapping 2:45-55. Granger, C.W.J. (1969). Investigating causal relations by econometric methods and cross-spectral Methods. Econometrica 34:424-438. Guo, Y., Bowman, F.D., Kilts, C. (2008). Predicting the brain response to treatment using a Bayesian Hierarchical model. Human Brain Mapping 29(9): 1092-1109. Guo, Y. and Pagnoni, G. (2008). A unified framework for group independent component analysis for multi-subject fMRI data. NeuroImage 42: 1078-1093. References Research Triangle Park, NC 42 42
Henson, R.N. (2006). Efficient experimental design for fMRI. (2006). In K. Friston, J. Ashburner, S. Kiebel, T. Nichols, and W. Penny (Eds), Statistical Parametric Mapping: The analysis of functional brain images. Elsevier, London, pp. 193-210. Nichols and Holmes (2002). Nonparametric permutation tests for functional neuroimaging: A primer with examples. Human Brain Mapping 15(1): 1-25. Patel, R., Bowman, F.D., Rilling, J.K. (2006). A bayesian approach to determining connectivity of the human brain. Human Brain Mapping 27:267-276. Roebroeck, A., Formisano, E., Goebel, R. (2005). Mapping directed influence over the brain using Granger causality and fMRI. Tzourio-Mazoyer, N., Landeau, B., Papathanassiou, D., Crivello, F., Etard, O., Delcroix, N., Mazoyer, B., M, J., (2002). Automated anatomical labeling of activations in SPM using a macroscopic anatomical parcellation of the MNI MRI single-subject brain. NeuroImage 15: 273-289. Wager, T.D., Nichols, T.E. (2003). Optimization of experimental design in fMRI: a general framework using a genetic algorithm. NeuroImage 18:293-309. References Research Triangle Park, NC 43 43