Download
1 / 17
170 likes | 186 Vues
This study investigates the genetic factors and expression analysis in Antiphospholipid Syndrome (APS) and Systemic Lupus Erythematosus (SLE). It includes principal component analysis, quantile-quantile plots, and association analysis of HLA alleles.

E N D
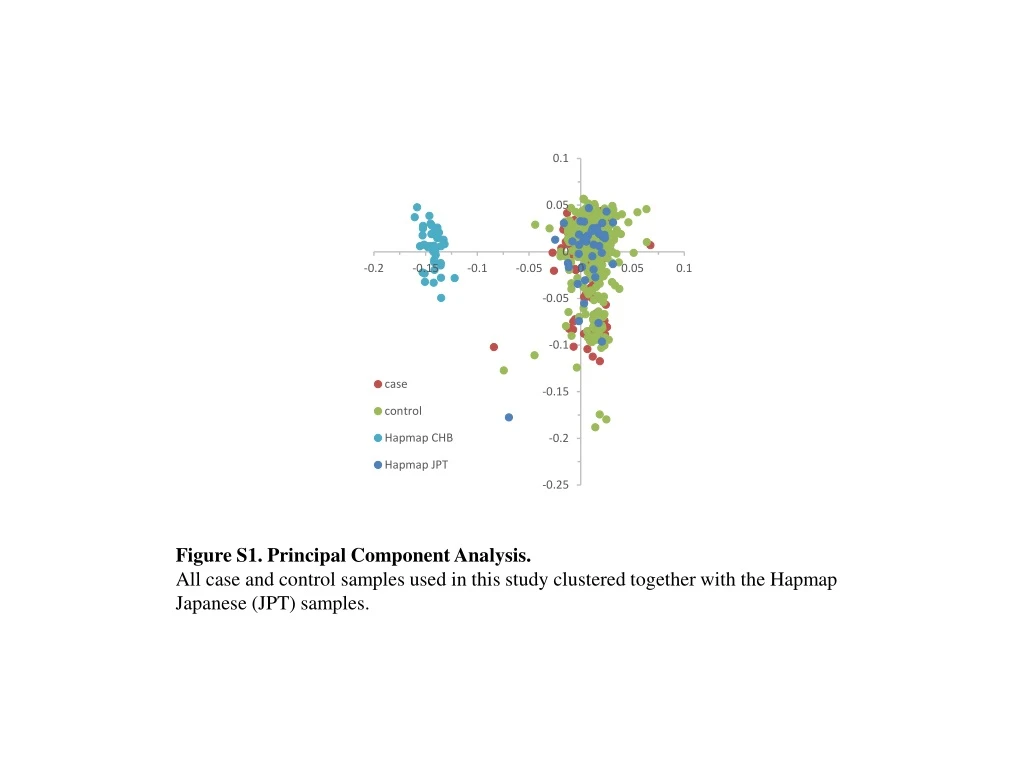
Figure S1. Principal Component Analysis. All case and control samples used in this study clustered together with the Hapmap Japanese (JPT) samples.
Chi-Squared -log 10 P (allelic model) Chi-Squared -log 10 P (dominant model) Chi-Squared -log 10 P (recessive model) Chi-Squared expected -log 10 P (allelic model) Chi-Squared expected -log 10 P (dominant model) Chi-Squared expected -log 10 P (recessive model) Figure S2. Quantile-quantile plots under the allelic, dominant and recessive models. The dots represent p values of each SNP that passed the quality control filter. The inflation factor lambda under the allelic, dominant and recessive model were estimated to be 1.053, 1.054 and 1.123, respectively. This result indicates that the effect of population stratification was negligible under the allelic and dominant model. On the other hand, substantial inflation was observed under the recessive model compared with the other models.
a c b Figure S3. Expression quantitative trait analysis of the genotype rs2288493 and the TSHR gene. An association between the genotype rs2288493 and the expression level of the TSHR gene was evaluated in the GTEx portal database.
a b Chi-Squared -log 10 P (recessive model) Chi-Squared -log 10 P (dominant model) Chi-Squared -log 10 P (allelic model) Chi-Squared -log 10 P (allelic model) Figure S4. Correlation between the p-values under allelic and one under dominant or recessive models allelic model. The dots represent data of each SNP. SNPs which has at least 5 counts in each column of 2x2 cross-table were included in this analysis to avoid incorrect estimation of p-values. The R2 value between the p-values under the allelic model and those under the dominant model was 0.7138 (a), whereas that between the p-values under the allelic model and those under the recessive model was 0.2507 (b), indicating low correlation coefficiency of the results under the recessive model compared with those under the allelic model. SNPs with a p-value less than 1.00E-05 under the recessive model showed p-value more than 1.00E-03 under the allelic model.
Table S1-1 List of 161 SNPs with a p value less than 0.0001 in this study (115 APS cases vs 419 controls)
Table S1-6 MAF: minor allele frequency CI: Confidence interval
Table S2 Posterior probability range for two-field HLA predictions for the APS dataset based on THC references
Table S3 Association analysis of HLA-Aalleles with APS OR: odds ratio CI: Confidence interval Bonferroni corrected threshold = 0.0036 (0.05/14)
Table S4 Association analysis of HLA-Balleles with APS OR: odds ratio CI: Confidence interval Bonferroni corrected threshold = 0.0020 (0.05/25)
Table S5 Association analysis of HLA-DPB1 alleles with APS OR: odds ratio CI: Confidence interval Bonferroni corrected threshold = 0.0042 (0.05/12)
Table S6 Association analysis of HLA-DQB1alleles with APS OR: odds ratio CI: Confidence interval Bonferroni corrected threshold = 0.0039 (0.05/13)
Table S7 Association analysis of HLA-DRB1alleles with APS OR: odds ratio CI: Confidence interval Bonferroni corrected threshold = 0.0023 (0.05/22)
Table S8. Possible Shared genetic factors between SLE and APS MAF: minor allele frequency CI: Confidence interval


