Water Power Peer Review
100 likes | 335 Vues
Water Power Peer Review. Paul T. Jacobson. Electric Power Research Institute (410) 489-3675 pjacobson@epri.com November 3, 2011. Wave Energy Resource Assessment and GIS Database for the U.S. Purpose, Objectives, & Integration.

Water Power Peer Review
E N D
Presentation Transcript
Water Power Peer Review Paul T. Jacobson Electric Power Research Institute (410) 489-3675 pjacobson@epri.com November 3, 2011 Wave Energy Resource Assessment and GIS Database for the U.S.
Purpose, Objectives, & Integration A comprehensive understanding of U.S. wave resources is of critical importance to accelerate development and commercialization of emerging wave energy technologies. This project estimates the total available and technically recoverable U.S. wave energy resources. Other project deliverables include a geospatial database, verified and validated by a third party, which displays annual and monthly average wave power densities and other sea state parameters for specific geographic coordinates, as well as an accessible data base of hindcast parameters archived at 3-hour intervals over a 51-month hindcast period.
Purpose, Objectives, & Integration Expected users of this product include policymakers, project developers, wave energy device developers, investors, universities, non-governmental organizations, environmental groups, the Department of Energy, and the military. Policymakers will be able to use the deliverables from this project to characterize the total available and recoverable wave energy resources for the nation and by region and by state. Such information can be used to inform Department of Energy decisions regarding allocation of R&D funding and identify technical and non-technical barriers associated with the geographic distribution of the resource.
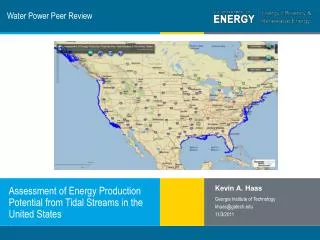
Technical Approach Rigorous estimation of available and recoverable wave energy resources required extensive analysis and synthesis of wave hindcasts and measurements that were originally designed to meet other objectives. 51-month Wavewatch III hindcast database developed especially for this study by NOAA’s National Centers for Environmental Prediction to calculate available wave power density (kilowatts per meter of wave crest width crossing a unit diameter circle) at over 76,000 grid points in U.S. coastal waters.
Technical Approach Mapped out to a distance of 50 nautical miles from shore (corresponding to the limits of NREL’s map of offshore wind power density). Independent validation of hindcast results against wave measurements was performed by the National Renewable Energy Laboratory “typicalness” study to determine how well the 51-month period of the Wavewatch III hindcast represented the longer-term wave climate.
Technical Approach Estimated the total naturally available and technically recoverable wave energy resources by aggregating unit circle wave power density estimates along inner and outer shelf depth contours. To estimate the recoverable resource, assumed: • array capacity packing of 10 MW, 15 MW, and 20 MW per kilometer • 100-fold device operating range between threshold and maximum operating conditions in terms of wave power density recoverable by devices in such arrays.
Plan, Schedule, & Budget Schedule • Initiation date: 9/15/2008 • Planned completion date: 11/15/2011 • Reasons for project delay include special Wavewatch III hindcast prepared for this project and additional analysis to address concerns raised by NRC review panel • FY 2010 and FY 2011 milestones include: 2nd expert and user workshop, May, 2010; validated available wave energy assessment, June, 2010; GIS data base, October, 2011; response to NRC panel comments, September, 2011; technical (recoverable) assessment, September, 2011. Budget: • No budget modifications • 100% of budget expended
Accomplishments and Results The total available wave energy resource along the U.S. continental shelf edge, based on accumulating unit circle wave power densities, is estimated as 2,640 TWh/yr, broken down as follows (TWh/yr): West Coast, 590; East Coast, 240; Gulf of Mexico, 80; Alaska, 1570; Hawaii, 130; and Puerto Rico, 30. The total recoverable wave energy resource, as constrained by a capacity packing density of 15 megawatts per kilometer of coastline, yields a total recoverable resource along the U.S. shelf edge of 1,170 TWh/yr, broken down as follows (TWh/yr): West Coast, 250; East Coast, 160; Gulf of Mexico, 60; Alaska, 620; Hawaii, 80; and Puerto Rico, 20.
Challenges to Date Some reviewers expressed concerns that the aggregation of unit circle wave power densities overestimates the total available resource by “double-counting” wave energy that is traveling parallel to the depth contours. To address these reviewer concerns, we quantified the difference between our unit circle approach and their more rigorous approach, which would consider only the flux normally directed across a linear feature such as a depth contour or jurisdictional boundary, by comparing the results of both approaches at 17 National Data Buoy Center stations for which full directional hindcast spectra had been archived.
Next Steps Dissemination of project results Future research should apply the methodologies developed by this project to a longer hindcast period, which is being developed by NOAA. Wave energy mapping should be extended into shallower water in selected regions using appropriate models and data. Near field effects of wave devices and arrays on wave propagation should be further investigated.