Download
1 / 25
250 likes | 271 Vues
This course provides an overview of drainage design principles, including delineating watersheds, determining storm runoff, and sizing drainage structures. It also covers the importance of significant figures in calculations. Topics include accuracy, precision, watershed mapping, and hydrograph analysis.

E N D
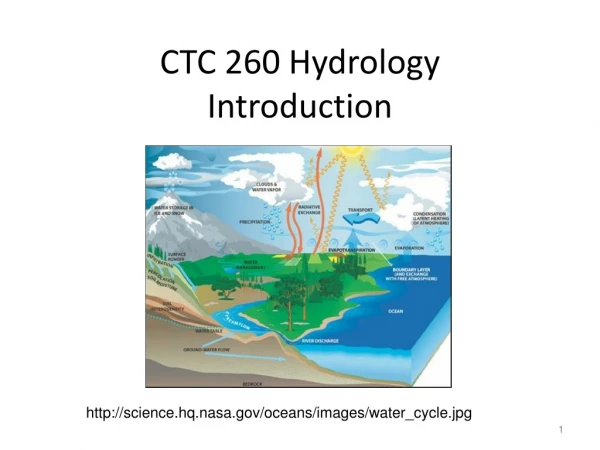
CTC 260 HydrologyIntroduction http://science.hq.nasa.gov/oceans/images/water_cycle.jpg
Objectives • Class Requirements • Drainage Design Overview • Review of Significant Figures • Review of Accuracy and Precision
Class Requirements • On-Web: www.sunyit.edu/~barans • Syllabus • Schedule • Lectures/Assignments • Grades • Academic Integrity Policy (page 45)
Former Handouts-Now Electronic • Hydro-35 • TR-55
Drainage Design • Hydrology – Determine water quantity • Hydraulics – Size structure to handle water
Steps • Delineate Watershed • Collect Watershed Data • Determine Design Storm • Determine Excess Precipitation (runoff) • Determine Peak Flow • Size Structure
Watershed Data • Land Use • Soil Types • Overland flow Length • Length of Channel • Slope • Vegetative Cover • Roughness Coefficient • Existing Storage • Channel Shape • Existing Drainage Structures
Delineate Watershed • Identify points of interest • Existing/Proposed Culvert Locations • Changes in Land Use • Major Stream Branching • Define Watershed Boundary • Delineate Subcatchment Areas • Determine Drainage Areas
Watershed Demo • http://techalive.mtu.edu/meec/module01/whatiswatershed.htm
Design Storm • Return period (frequency) • Precipitation data • IDF • Rainfall Intensity • Storm Duration • Storm Frequency
Runoff • Part of design storm will become runoff and part will be retained by watershed (abstraction) • Dependent on: • Soil type • Cover type/land Treatment • Land Use • Antecedent runoff condition • Impervious/pervious relationship
Hydrograph Graph of time vs direct runoff at one particular location Rising limb Crest Falling (Recessional) Limb
Unit Hydrograph • Hydrograph representing 1” of excess precipitation occurring uniformly over the watershed for a specified storm duration
Ungaged Watershed • If watershed is ungaged, then a synthetic unit hydrograph is developed from empirical equations
Sizing Drainage Structures • Inlets • Ditches • Culverts • Storm drainage system • Detention Basin • Open channel flow • Energy/Hydraulic Grade Lines • Friction • Pressure • Head Loss
Documenting Work • Narrative on what was done and why • Map of watershed delineations • Tables summarizing info • Nomographs/equations used • References
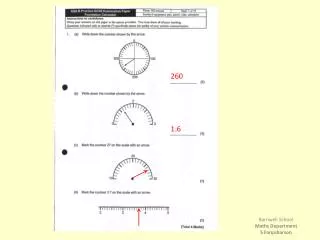
Significant Figures • Number of digits used to form a quantity • 132, 4.01, and 0.00425 all have 3 significant figures • 350, 2500, 92,000 all have 2 significant figures • 350., 2500., 92,000. have 3, 4, and 5 significant figures, respectively
Numbers not subject to significant digits • pi • Formulas (2*pi*r)---2 is exact
Measured numbers-significant digits • 229 feet – assumed measured to the nearest foot (could be 228.5 to 229.4); has 3 significant figures • 229.5 feet – assumed to be measured to the nearest 0.1 foot (could be 229.45 to 229.54); has 4 significant figures • 230 feet (2 significant figures; measured to nearest 10 feet) • 230. feet (3 significant figures; measured to nearest 1 foot)
Significant Digits-Computation Rules • Multiplication and Division • Answer should have no more significant figures than the least number of significant figures in any quantity in the computation • Example: 230.0 x 20. = 460 (2 significant figures; not 460. which would imply 3 significant figures)
Significant Digits-Computation Rules • Addition and Subtraction • Answer should have no more digits to the rights of the decimal point than the least number of digits to the right of the decimal point in any quantity in the • Example 230.1 + 20. = 250. (3 significant figures; not 2; not 4)
Significant Digits – Computation in Series • Series • If the answer to one computation is used in another computation, then the final answer is rounded to the quantity with the lowest number of significant digits
Accuracy and Precision • Accuracy-how close a value is to the actual value • Precision-how many significant digits are displayed • Avoid displaying lots of numbers because your calculator displays lots of numbers (answer looks precise but is not necessarily accurate)
Next Lecture • Watersheds • What are they? • Why are they important? • How do you delineate them? • How do you measure their areas?