Download

1 / 25
250 likes | 395 Vues
Raoul LePage Professor STATISTICS AND PROBABILITY www.stt.msu.edu/~lepage click on STT315_Sp05. Week 3. suggested exercises solutions given in text 2-61, 2-63, 2-65, 2-67, 2-69, 2-73, 2-75 ( "or both" is redundant ), 2-77 ( i.e. P( B up | A up ) ), 3-1, 3-5,

E N D
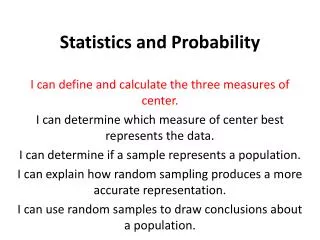
Raoul LePage Professor STATISTICS AND PROBABILITY www.stt.msu.edu/~lepage click on STT315_Sp05 Week 3.
suggested exercises solutions given in text 2-61, 2-63, 2-65, 2-67, 2-69, 2-73, 2-75 ( "or both" is redundant ), 2-77 ( i.e. P( B up | A up ) ), 3-1, 3-5, 3-11, 3-15, 3-17, 3-23 and s.d., 3-25 Week 3.
“oil” = oil is present“+” = a test for oil is positive“-” = a test for oil is negative TREE DIAGRAM + - oil false negative false positive + no oil -
P(oil) = 0.3P(+ | oil) = 0.9P(+ | no oil) = 0.4 TREE DIAGRAM CONVENTIONS P(oil +) = (0.3)(0.9) = 0.27 P(+ | oil) = 0.9 + P(oil) = 0.3 - oil + no oil -
P(oil) = 0.3P(+ | oil) = 0.9P(+ | no oil) = 0.4 TOTAL OF BRANCHES = 1 sum of unconditional probabilities is one 0.3 oil 0.7 no oil
P(oil) = 0.3P(+ | oil) = 0.9 P(- | oil) = 0.1P(+ | no oil) = 0.4 TOTAL OF CONDITIONAL BRANCHES = 1 sum of conditional probabilities is one 0.9 + 0.3 0.1 - oil 0.7 + no oil -
P(oil) = 0.3P(+ | oil) = 0.9P(+ | no oil) = 0.4 COMPLETE TREE 0.27 oil+ 0.9 unconditional + 0.1 0.3 - oil 0.03 oil- 0.7 0.28 oil+ 0.4 + no oil 0.6 - 0.42 oil- conditional outcomes
VENN DIAGRAM S oil + 0.03 0.27 0.28 0.42 0.27 oil+ 0.9 + 0.1 0.3 - oil- 0.03 oil 0.7 oil+ 0.28 0.4 + no oil - 0.6 0.42 oil-
TOTAL PROBABILITY P(+) = P(oil+) + P(no oil+) 0.55 = 0.27 + 0.28 0.27 oil+ 0.9 + 0.3 oil 0.7 oil+ 0.28 0.4 + no oil Oil contributes 0.27 to the total P(+) = 0.55.
BAYES FORMULA S oil + 0.03 0.27 0.28 0.42 0.27 oil+ P(oil | +) = P(oil+) / P(+) = 0.27 / (0.27 + 0.28) = 0.4909.. oil+ 0.28 Oil contributes 0.27 of the total P(+) = 0.27+0.28.
MEDICAL TEST 0.98 0.01 disease + 0.02 - + 0.03 0.99 no disease 0.97 - The test for this infrequent disease seems to be reliable having only 3% false positives and 2% false negatives. What if we test positive?
MEDICAL TEST 0.0098 0.01 disease 0.98 + 0.02 - 0.0002 0.0297 + 0.03 0.99 no disease 0.97 - 0.9603 We need to calculate P(diseased | +), the conditional probability that we have this disease GIVEN we’ve tested positive for it.
CALCULATING OUR CHANCES OF HAVING THE DISEASE IF + 0.0098 0.01 disease 0.98 + 0.02 - 0.0002 0.0297 + 0.03 0.99 no disease 0.97 - 0.9603 P(+) = 0.0098 + 0.0297 = 0.0395 P(disease | +) = P(disease+) / P(+) = .0098 / 0.0395 = 0.248. only 25% !
FALSE POSITIVE PARADOX one may overwhelm a good test by failing to screen 0.0098 0.98 0.01 disease + 0.02 - 0.0002 0.0297 + 0.03 0.99 no disease 0.97 - 0.9603 EVEN FOR THIS ACCURATE TEST: P(diseased | +) is only around 25% because the non-diseased group is so predominant that most positives come from it.
IMPLICATIONS OF THE PARADOX FOR MEDICAL PRACTICE: Good diagnostic tests will be of little use if the system is over-whelmed by lots of healthy people taking the test. Screen patients first. FOR BUSINESS: Good sales people capably focus their efforts on likely buyers, leading to increased sales. They can be rendered ineffective by feeding them too many false leads, as with massive un-targeted sales promotions.
probability 2 0.2 3 0.2 4 0.3 5 0.1 6 0.1 7 0.05 8 0.05 total 1 RANDOM VARIABLE (3-17 of text) boats/month P(fewer than 3.7) = .4 P(4 to 7) = .55
P(oil) = 0.3 OIL DRILLING EXAMPLE Cost to drill 130 Reward for oil 400 net return “just drill” -130 + 400 = 270 drill oil drill no oil -130 + 000 = -130 0.3 oil 0.7 no oil A random variable is just a numerical function over the outcomes of a probability experiment.
EXPECTATION Definition of E X E X = sum of value times probability x p(x). Key properties E(a X + b) = a E(X) + b E(X + Y) = E(X) + E(Y) (always, if such exist) a. E(sum of 13 dice) = 13 E(one die) = 13(3.5). b. E(0.82 Ford US + Ford Germany - 20M) = 0.82 E(Ford US) + E(Ford Germany) - 20M regardless of any possible dependence.
total of 2 dice (3-15) of text probabilityproduct 2 1/36 2/36 3 2/36 6/36 4 3/36 12/36 5 4/36 20/36 6 5/36 30/36 7 6/36 42/36 8 5/36 40/36 9 4/36 36/36 10 3/36 30/36 11 2/36 22/36 12 1/3612/36 sum 1 252/36 = 7 E ( total ) is just twice the 3.5 avg for one die E(total)
probabilityproduct 2 0.2 0.4 3 0.2 0.6 4 0.3 1.2 5 0.1 0.5 6 0.1 0.6 7 0.05 0.35 8 0.05 0.4 total 1 4.05 (3-17 of text) boats/month we avg 4.05 boats per month E(number of boats this month)
EXPECTATION IN THE OIL EXAMPLE Expected return from policy “just drill” is the probability weighted average (NET) return E(NET) = (0.3) (270) + (0.7) (-130) = 81 - 91 = -10. net return from policy“just drill.” -130 + 400 = 270 drill oil drill no-oil -130 + 0 = -130 just drill 0.3 oil 0.7 no oil E(X) = -10
OIL EXAMPLE WITH A "TEST FOR OIL" A test costing 20 is available. This test has: P(test + | oil) = 0.9 P(test + | no-oil) = 0.4. “costs” TEST 20 DRILL 130 OIL 400 0.27 + 0.9 0.3 0.1 - oil 0.03 0.28 0.7 0.4 + no oil 0.6 - 0.42 Is it worth 20 to test first?
EXPECTED RETURN IF WE "TEST FIRST" net return prob prod oil+ = -20 -130 + 400 = 250 0.27 67.5 oil- = -20 - 0 + 0 = - 20 .03 - 0.6 no oil+ = -20 -130 + 0 = -150 .28 - 42.0 no oil- = -20 - 0 + 0 = - 20 .42 - 8.4 total 1.00 16.5 drill only if the test is + E(NET) = .27 (250) - .03 (20) - .28 (150) - .42 (20) = 16.5 (for the “test first” policy). This average return is much preferred over the E(NET) = -10 of the “just drill” policy.
Variance and s.d. of boats/month (3-17) of text x p(x) x p(x) x2 p(x) (x-4.05)2 p(x) 2 0.2 0.4 0.8 0.8405 3 0.2 0.6 1.8 0.2205 4 0.3 1.2 4.8 0.0005 5 0.1 0.5 2.5 0.09025 6 0.1 0.6 3.6 0.38025 7 0.05 0.35 2.45 0.435125 8 0.05 0.4 3.2 0.780125 total 1.00 4.05 19.15 2.7475 quantity E X E X2 E (X - E X)2 terminology mean mean of squares variance = mean of sq dev s.d. = root(2.7474) = root(19.15 - 4.052) = 1.6576