Download
1 / 26
270 likes | 562 Vues
UV-VISIBLE Spectrometers DOBSON and SAOZ. Andrea Pazmiño and Alain Sarkissian LATMOS, Institut Pierre Simon Laplace, CNRS-UVSQ-UPMC, Paris, France Outline History The Dobson The SAOZ. Measurement of minor atmospheric constituents Beer-Lambert Law: I = I 0 . e -

E N D
UV-VISIBLE Spectrometers DOBSON and SAOZ • Andrea Pazmiño and Alain Sarkissian • LATMOS, Institut Pierre Simon Laplace, CNRS-UVSQ-UPMC, Paris, France • Outline • History • The Dobson • The SAOZ
Measurement of • minor atmospheric constituents • Beer-Lambert Law:I = I0 .e - • = -ln(I/I0) • and • = .NL +Ray + Mie • : absorption cross section • NL : number of molecules in the line-of-sight N L
1877-1907 Regular measurements of ground ozone concentration at Montsouris Park (Albert Lévy) 1979 First measurements from orbit by TOMS 1985 Discovery of the ozone hole (in Antarctica) Measurements of ozone by Dobson at Faraday, Antarctica OCTOBER 1988 First measurement of ozone by SAOZ (Dumont d'Urville, Antarctica) in the frame of the Montreal Protocol (1987) History 1924 Dobson develop an ultraviolet spectrograph to measure the integrated ozone(column)
Measurement of • minor atmospheric constituents stratosphere Earth Nv If Nvcorrespond to the vertical column of constituent x: Nvx = NLx(SZA,) / AMFx(SZA,) AMF = Air Mass Factor
Measurement of atmospheric minor constituents • by UV-visible spectrometry • I / I0 = e - • Beer-Lambert law: = log(I0/I) • = . N • Absorption cross section • N Number of molecules in the line-of-sight 2 Satellite Orbit Star or Sun or Moon 3 2 Planet Ground-Based Atmospheric layer 1
Spectrometers Photodetector Dispersive object Entrance slit Output slit ► Passive remote sensing and not destructive method Decomposition of light radiation following → analysis of the spectral distribution Characterized by its resolution (ability to separate two very close wavelengths) ► ►
Dobson and SAOZ spectrometers • Differential absorption (absolute) • O3 • Direct Sun measurements • Measurements in theUltraviolet • (Huggins band) • No measurements during polar winter • No measurements in bad weather • Automatic and/or manual • More than 80 instruments • Long series (80 years in Arosa) • DOAS technique (relative) • O3, NO2, OClO, PSC • Zenith-sky measurements at twilight • Measurements in the Visible • (Chappuis band) • Measurements in polar regions in winter • Measurements in all weather conditions • Completely automatic • 20 instruments • >20 years of measurements in Antarctica
O3 • Dobson Measurements • I / I0 = e - • Generally, direct Sun measurements • → AMF = 1 / cos (SZA) • The Dobson spectrometer uses 2 pairs of wavelengths • = . NL → = . NL where • = diff. Mie scattering contribution + ( . NL ) O3
sO3 = f(T) Pairs of wavelengths used by Dobson spectrometer • Double pairs AD: most reliable for direct Sun measurements→ standard • Double pairs CD: large optical path
Dobson network Fioletov et al., 2008
Dobson measurements: trends Arosa, Switzerland since 1926 Dobson Ozone [DU] Year
Conclusion: Dobson • ground-based measurements • direct Sun measurements (generally), or at zenith-sky • measurements in the UV (Huggins band for O3) • uses pairs of wavelengths • differential absorption • simple geometry (AMF = 1/cos(SZA) for direct sun measurements) • ==> ++ and -- • ++ good accuracy (< 1-2 %) • ++ systematic comparison between instruments (calibration) • ++ 80 instruments • ++very long series • -- not in winter at polar regions • -- not when bad weather • -- needs operator • -- needs correction of absorption cross section of ozone in the UV • from temperature
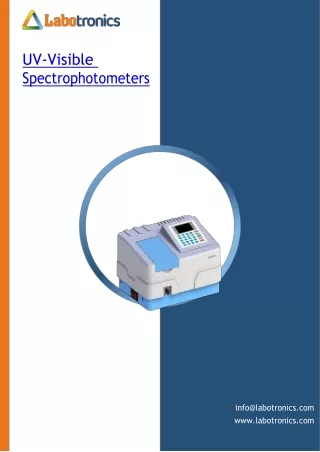
SAOZ spectrometer Systèmed’AnalyseparObservationZenithale
GPS antenna shutter, grating, detector Electronic device SAOZ spectrometer SAOZ SAOZ Interface PC ARGOS Outside Inside
O3 SAOZ spectrometer • Zenith-sky viewing • Twilight geometry • High sensitivity to the stratosphere (~200 km) Vertical column calculation: Slant column Residual amount in reference spectrum Air mass factor
Beer-Lambert Law I=Io * e –t SAOZ spectrometer Spectral Analysis Comparison of spectrum to the reference spectrum re-adjust the spectrum in wavelength I/Io Reference (Io) 45° Flux (x103 arbitrary units) Signal (I) Wavelength (nm)
Application of high pass filter Dt = Ds NL SAOZ spectrometer Spectral Analysis Optical Thickness Absorption cross-section NO2 O3 t = -ln(I/Io) s 1) To suppress attenuations of lower frequency (Rayleigh and Mie) 2) Least mean square correlation => NL (measured slant column)
SAOZ spectrometer Differential Spectral Analysis O3 NO2 O4 H2O Dti Dsi NLi Residual Differential Spectrum 0.020 0.015 0.010 0.005 0 -0.005 -0.010 -0.015 -0.020 -0.025 -0.030 Dt residual Dt =Dt – S Ds NL < 1/1000
SAOZ spectrometer VO3= NLO3+R0/AMFO3 NLO3= DtO3 /DsO3 320 DU Colonne Verticale (DU) Colonne oblique (x1018 mol./cm2) 86°<SZA<91° 86°<SZA<91° Standards SAOZ data : daily vertical columns of O3 and NO2 at twilight
SAOZ network Thule Ny-Alesund Sodankyla Zhigansk Scoresbysund Salekhard Harestua Aberystwyth Jungfrau OHP Tarawa Reunion Bauru Kerguelen Rio Gallegos Rothera Dumont d’Urville Concordia
SAOZ Long term series at Dumont d’Urville Ozone (DU) NO2 (x1015 mol/cm2)
SAOZ Monthly Mean Colonne verticale d’ozone (DU) Differences (Satellite-SAOZ)/SAOZ (%) TOMS : -0,6% SCIA : -0,3% GOME : 0,5% OMI (TOMS) : -1.3% OMI (DOAS) : 0% Comparison with satellites at OHP
SAOZ Ozone loss: methodology Comparison of passiveO3of models with SAOZ measurements O3 : accumulated ozone loss 2 models : REPROBUS & SLIMCAT
SAOZ Arctic ozone loss Sensibility of O3 loss to history of stratospheric temperature => high annual variability Warm winters: 5-13% or 25-60 DU (eg. 1998/99, ) Cold winters: 20-30% or 90-140 DU (eg. 2007/08, )
Conclusions: SAOZ • - ground-based measurements • - zenith-sky measurements at twilight • - ozone measured in the visible Chappuis band • - differential absorption • - complicated geometry (AMF = f(SZA,)) • ++ good accuracy (<3% for ozone) • ++ >20 years series in polar regions • ++ measurements in polar regions in winter when ozone hole forms • ++ completely automatic • ++ measurements in all weather conditions • ++ simultaneously measurements of NO2, OClO, BrO and PSC detection • -- needs radiative transfer calculation (AMF) • -- sensible to vertical profiles that generates seasonal variation SAOZ data of O3 & NO2 in real time (current year) & consolidate (already validated by the Principal Scientist and sent toNDACC) : - http://saoz.obs.uvsq.fr/SAOZ-RT.html - http://saoz.obs.uvsq.fr/SAOZ_consol_v2.html