UV-visible spectroscopy
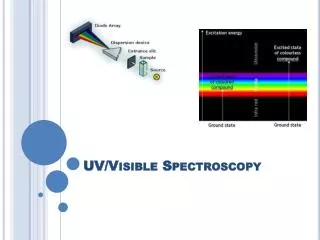
UV-visible spectroscopy. How They Work. What is Spectroscopy?. The study of molecular structure and dynamics through the absorption, emission and scattering of light. What is Light?.

UV-visible spectroscopy
E N D
Presentation Transcript
UV-visible spectroscopy How They Work
What is Spectroscopy? • The study of molecular structure and dynamics through the absorption, emission and scattering of light.
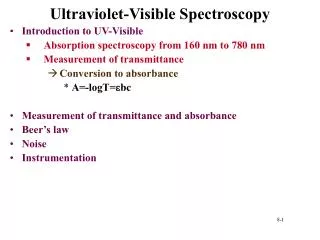
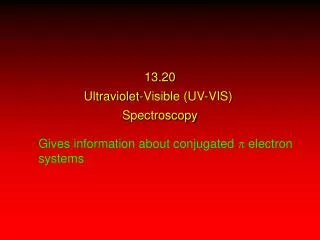
What is Light? • According to Maxwell, light is an electromagnetic field characterized by a frequency f, velocity v, and wavelength λ. Light obeys the relationship f = v / λ.
The Electromagnetic Spectrum E = hn n = c / l
X-Ray UV Microwave Visible IR 200nm 400nm 800nm WAVELENGTH(nm) Spectroscopy Spectral Distribution of Radiant Energy Wave Number (cycles/cm)
Transmission and Color The human eye sees the complementary color to that which is absorbed
Two-Component Mixture Example of a two-component mixture with little spectral overlap
Two-Component Mixture Example of a two-component mixture with significant spectral overlap
Influence of 10% Random Error • Influence on the calculated concentrations • Little spectral overlap: 10% Error • Significant spectral overlap: Depends on similarity, can be much higher (e.g. 100%)
Light Sources UV Spectrophotometer 1. Hydrogen Gas Lamp 2. Mercury Lamp Visible Spectrophotometer 1. Tungsten Lamp InfraRed (IR) Spectrophotometer 1. Carborundum (SIC)
Dispersion Devices • Non-linear dispersion • Temperature sensitive • Linear Dispersion • Different orders
Dispersion of polychromatic light with a prism Infrared monochromatic Ray Red Orange SLIT Yellow Polychromatic Green PRISM Ray Blue Violet Ultraviolet Polychromatic Ray Monochromatic Ray Prism - spray out the spectrum and choose the certain wavelength (l) that you want by moving the slit.
Photomultiplier Tube Detector • High sensitivity at • low light levels • Cathode material • determines spectral sensitivity • Good signal/noise • Shock sensitive Anode
The Photodiode Detector • Wide dynamic range • Very good • signal/noise at high light levels • Solid-state device
Schematic Diagram of a Photodiode Array • Same characteristics • as photodiodes • Solid-state device • Fast read-out cycles
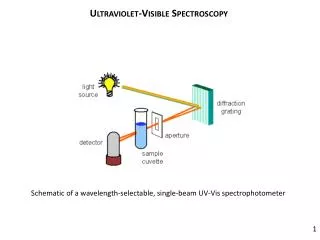
Conventional Spectrophotometer Schematic of a conventional single-beam spectrophotometer
Conventional Spectrophotometer Optical system of a double-beam spectrophotometer
Conventional Spectrophotometer Optical system of a split-beam spectrophotometer
Definition of Resolution Spectral resolution is a measure of the ability of an instrument to differentiate between two adjacent wavelengths
Instrumental Spectral Bandwidth The SBW is defined as the width, at half the maximum intensity, of the band of light leaving the monochromator
Natural Spectral Bandwidth The NBW is the width of the sample absorption band at half the absorption maximum
Transmission Characteristics of Cell Materials Note that all materials exhibit at least approximately 10% loss in transmittance at all wavelengths
Cells UV Spectrophotometer Quartz (crystalline silica) Visible Spectrophotometer Glass IR Spectrophotometer NaCl
Cell Types I Open-topped rectangular standard cell (a) and apertured cell (b) for limited sample volume
Cell Types II Micro cell (a) for very small volumes and flow-through cell (b) for automated applications
Transmittance and Path Length: Beer’s Law Concentration
BEER LAMBERT LAW As the cell thickness increases, the intensity of I (transmitted intensity of light ) decreases.
R- Transmittance R = I0 - original light intensity I- transmitted light intensity % Transmittance = 100 x Absorbance (A) or optical density (OD) = Log = Log = 2 - Log%T Log is proportional to C (concentration of solution) and is also proportional to L (length of light path through the solution). I0 1 I T I I I I0 I0 I0
A CL = KCL by definition and it is called the Beer Lambert Law. A = KCL K = Specific Extinction Coefficient ---- 1 g of solute per liter of solution A = ECL E = Molar Extinction Coefficient ---- Extinction Coefficient of a solution containing 1g molecule of solute per 1 liter of solution
E differs from K (Specific extinction Coefficient) by a factor of molecular weight. UNITS A = ECL A = No unit (numerical number only)
Liter K= Cm Gram L = Cm C = Moles/Liter A = KCL A = No unitC = Gram/Liter L = Cm
STEPS IN DEVELOPING A SPECTROPHOTOMETRIC ANALYTICAL METHOD • Run the sample for spectrum • 2. Obtain a monochromatic wavelength for the maximum absorption wavelength. • 3. Calculate the concentration of your sample using Beer Lambert Equation: A = KCL
There is some A vs. C where graph is linear. NEVER extrapolate beyond point known where becomes non-linear.
SPECTROMETRIC ANALYSIS USING STANDARD CURVE Avoid very high or low absorbencies when drawing a standard curve. The best results are obtained with 0.1 < A < 1. Plot the Absorbance vs. Concentration to get a straight line
Every instrument has a useful range for a particular analyte. • Often, you must determine that range experimentally. • This is done by making a dilution series of the known solution. • These dilutions are used to make a working curve.
Make a dilution series of a known quantity of analyte and measure the Absorbance. Plot concentrations v. Absorbance.
In this graph, values above A=1.0 are not linear. If we use readings above A=1.0, graph isn’t accurate.
The best range of this spectrophotometer is A=0.1 to A=1.0, because of lower errors. A=0.4 is best.
Relating Absorbance and Transmittance • Absorbance rises linearly with concentration. Absorbance is measured in units. • Transmittance decreases in a non-linear fashion. • Transmittance is measured as a %. • Absorbance = log10 • (100/% transmittance)
Precision and Accuracy Precision – Precision + Precision – Precision + Accuracy – Accuracy – Accuracy + Accuracy +