Molecular UV-Visible Spectroscopy
410 likes | 774 Vues
Molecular UV-Visible Spectroscopy. Lecture Date: January 30 th , 2013. Electronic Spectroscopy (Review). Spectroscopy of the electrons surrounding an atom or a molecule: electron energy-level transitions. Atoms: electrons are in hydrogen-like orbitals (s, p, d, f).

Molecular UV-Visible Spectroscopy
E N D
Presentation Transcript
Molecular UV-Visible Spectroscopy Lecture Date: January 30th, 2013
Electronic Spectroscopy (Review) • Spectroscopy of the electrons surrounding an atom or a molecule: electron energy-level transitions Atoms: electrons are in hydrogen-like orbitals (s, p, d, f) Molecules: electrons are in molecular orbitals (HOMO, LUMO, …) From http://education.jlab.org (The LUMO of benzene) (The Bohr model for nitrogen)
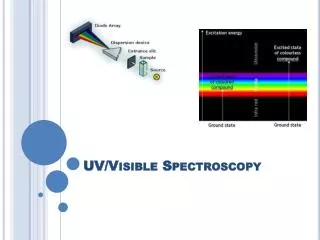
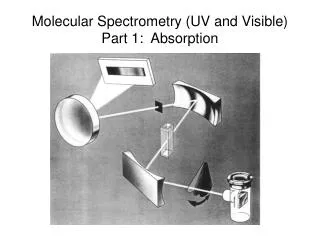
Molecular UV-Visible Spectroscopy • Molecular UV-Visible spectroscopy is driven by electronic absorption of UV-Vis radiation • Molecular UV-Visible spectroscopy can: • Enable structural analysis • Detect molecular chromophores • Analyze light-absorbing properties (e.g. for photochemistry) • Basic UV-Vis spectrophotometers acquire data in the 190-800 nm range and can be designed as “flow” systems. Figures from http://www.cem.msu.edu/~reusch/VirtualText/Spectrpy/UV-Vis/uvspec.htm#uv1
Molecular UV-Vis Spectroscopy: Terminology • UV-Vis Terminology • Chromophore: a UV-Visible absorbing functional group • Bathochromic shift (red shift): to longer wavelengths • Auxochrome: a substituent on a chromophore that causes a red shift • Hypsochromic shift (blue shift): to shorter wavelengths • Hyperchromic shift: to greater absorbance • Hypochromic shift: to lesser absorbance
Molecular UV-Vis Spectroscopy: Transitions • Major classes of electron transitions • HOMO: highest occupied molecular orbital • LUMO: lowest unoccupied molecular orbital • Types of electron transitions: (1) , and n electrons (mostly organics) (2) d and f electrons (inorganics/organometallics) (3) charge-transfer (CT) electrons
Molecular UV-Vis Spectroscopy: Theory • Molecular energy levels and absorbance wavelength: • * and * transitions: high-energy, accessible in vacuum UV (max <150 nm). Not usually observed in molecular UV-Vis. • n * and * transitions: non-bonding electrons (lone pairs), wavelength (max) in the 150-250 nm region. • n * and * transitions: most common transitions observed in organic molecular UV-Vis, observed in compounds with lone pairs and multiple bonds with max = 200-600 nm. Figure from http://www.cem.msu.edu/~reusch/VirtualText/Spectrpy/UV-Vis/spectrum.htm
Molecular UV-Vis Spectroscopy and Transition Metal and Lanthanide/Actinide Complexes • d/f orbitals • UV-Vis spectra of lanthanides/actinides are particularly sharp, due to screening of the 4f and 5f orbitals by lower shells. • Can measure ligand field strength, and transitions between d-orbitals made non-equivalent by the formation of a complex • Charge transfer (CT) – occurs when electron-donor and electron-acceptor properties are in the same complex – electron transfer occurs as an “excitation step” • MLCT (metal-to-ligand charge transfer) • LMCT (ligand-to-metal charge transfer) • Ex: tri(bipyridyl)iron(II), which is red – an electron is exicted from the d-orbital of the metal into a * orbital on the ligand
Molecular UV-Vis Spectroscopy: Absorption • max is the wavelength(s) of maximum absorption (i.e. the peak position) • The strength of a UV-Visible absorption is given by the molar absorption coefficient (): = 8.7 x 10¹⁹P a where P is the transition probability (0 to 1) – governed by selection rules and orbital overlap, and a is the chromophore area in cm2 • Molar absorption coefficient () then gives A via the Beer-Lambert Law: • A =ebc
Molecular UV-Vis Spectroscopy: Quantum Theory • UV-Visible spectra and the states involved in electronic transitions can be calculated with theories ranging from Huckel to ab initio/DFT. • Example: * transitions responsible for ethylene UV absorption at ~170 nm calculated with ZINDO semi-empirical excited-states methods (Gaussian 03W): LUMOg antibonding molecular orbital HOMOu bonding molecular orbital
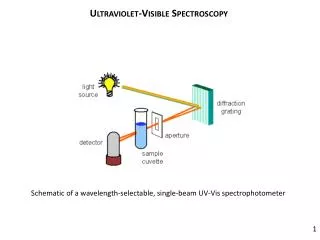
Molecular UV-Visible Spectrophotometers • The traditional UV-Vis design: double-beam grating systems • Sources: • Almost universal continuum UV-Vis source is the 2H lamp. • Tungsten lamps used for longer (visible) wavelengths. Hamamatsu L2D2 lamps Figure from http://www.cem.msu.edu/~reusch/VirtualText/Spectrpy/UV-Vis/uvspec.htm#uv1
Molecular UV-Visible Spectrophotometers • Diode array detectors can acquire all UV-Visible wavelengths at once. • Advantages: • Sensitivity (multiplex) • Speed • Disadvantages: • Resolution Figure from Skoog, et al., Chapter 13
Interpretation of Molecular UV-Visible Spectra • UV-Visible spectra can be interpreted to help determine molecular structure, but this is presently confined to the analysis of electron behavior in known compounds. • Information from other techniques (NMR, MS, IR) is usually far more useful for structural analysis • However, UV-Vis evidence should not be ignored! Figure from Skoog, et al., Chapter 14
Calculation of Molar Absorption Coefficient • The molar absorption coefficient () for each absorbance in a UV spectrum is calculated as follows: • , Molar Abs Coeff (AU mol-1 cm-1) = A x mwt / mass x pathlength • Solvent “cutoffs” for UV-visible work: Burdick and Jackson High Purity Solvent Guide, 1990
Interpretation of UV-Visible Spectra • Although UV-Visible spectra are no longer frequently used for structural analysis, it is helpful to be aware of well-developed interpretive rules. • Examples: • Woodward-Fieser rules for max dienes and polyenes • Extended Woodward rules for unsaturated ketones • Substituted benzenes (max base value = 203.5 nm) See E. Pretsch, et al., Structure Determination of Organic Compounds, Springer, 2000. (Chapter 8).
Interpretation of UV-Visible Spectra • Other examples: • The conjugation of a lone pair on a enamine shifts the max from 190 nm (isolated alkene) to 230 nm. The nitrogen has an auxochromic effect. • Why does increasing conjugation cause bathochromic shifts (to longer wavelengths)? See E. Pretsch, et al., Structure Determination of Organic Compounds, Springer, 2000. (Chapter 8). Figures from http://www.cem.msu.edu/~reusch/VirtualText/Spectrpy/UV-Vis/spectrum.htm
Interpretation of UV-Visible Spectra • Typical transition metal complexes show detailed spectra, unlike organic molecules • Lanthanide complexes show sharp lines caused by “screening” of the f electrons by other orbitals See Shriver et al. Inorganic Chemistry, 2nd Ed. Ch. 14
Quantitative UV-Visible Spectroscopy • UV-visible spectra can be used for direct quantitative analysis with appropriate calibration
Color Analysis with Visible Spectra • The visible region of a UV-Visible spectrum can be decomposed into a color analysis (typically three numbers) by simple calculations • Involves multiplying the visible portion of the spectrum by color functions and then taking the total area of the spectrum as a single number • Tristimulus values, which mimic the eye, are generally used and then other values are determined from these algebraically http://www.zeiss.de/c12567bb00549f37/Contents-Frame/80bd2fe43b50aa3ec125782c00597389
Diffuse Reflectance UV-Visible Spectroscopyof Solids • Solid powders can be studied using a diffuse reflectance (DR) accessory either neat or diluted in a non-absorbing powder
Diffuse Reflectance UV-Visible Spectroscopyof Solids • Typical diffuse reflectance spectrum of cyanocobalamin (vitamin B12), diluted to 5% w/w in MgO
Prediction of UV-Visible Spectra with Quantum Calculations: Time-dependent DFT • TDDFT: Time-dependent density functional theory currently provides accurate predictions of UV-visible spectra for organic molecules J. Mol. Struct. 2010, 984, 246–261, ttp://dx.doi.org/10.1016/j.molstruc.2010.09.036
Plane (or Linearly) Polarized Light • If the electric vector of an EM wave points in the same direction as that of the wave propagating through a medium, the light is said to be linearly polarized Figure from Sears, et al., “University Physics”, 7th Ed., 1988
Polarimetry and Optical Rotation • A polarimeter measures the angle of rotation of linearly polarized monochromatic light as it passes through a sample • Source: sodium arc lamp (589 nm), now commonly replaced with a yellow LED • Two polarizers before and after the sample. One is fixed and the other is rotated to find the maximum light transmitted, and the rotation is recorded. • Result is a single number, e.g. -10.02, the specific rotation • What happens when we vary the wavelength?
Optical Rotation and ORD • The rotation of plane polarized light by molecules: Eliel et al., “Stereochemistry of Organic Compounds”, p. 997. R. P Feynman, et al., “The Feynman Lectures on Physics”, 1963, Addison-Wesley. p. 33-6
Optical Rotatory Dispersion (ORD) • The measurement of specific rotation as a function of wavelength, in the absence of absorption, is monotonic (and governed by the Fresnel equation) • In the vicinity of an absorption, one obtains “anomalous dispersion”
UV-Visible Circular Dichroism • UV-visible or electronic circular dichroism (ECD or just CD) is the study of differential absorption of polarized UV-Visible radiation by chiral molecules. • CD measures the difference between LCPL and RCPL • Beer’s law for CD: • A = bc • Where = (LPCL - RPCL) • is the molar absorptivity (cm-1 M-1) • A is absorption See Eliel, et al. Stereochemistry of Organic Compounds, pg. 1003.
Circularly-Polarized UV-Visible Radiation • Circularly-polarized UV-visible radiation is made by mixing two orthogonal electric field components 90 degrees out of phase. • In practice, a quartz crystal is subjected to mechanical stress and (via the piezoelectric effect) causes circular polarization of the light Animation from http://www.bip.bham.ac.uk/osmart/bcm201_cd/cd_movie/index.html
UV-Visible Circular Dichroism • A typical UV-Visible CD spectrometer, the Jasco J-715
Electronic Circular Dichroism • CD spectra of (1S)-(+)-10-camphorsulfonic acid and (1R)-(+)-10-camphorsulfonic acid (ammonium salts) in H2O
TDDFT Calculations • TDDFT calculations have largely replaced empirical rules. • Example: (1R)-(+)-10-camphorsulfonic acid (ammonium salts) and its isomer calculated without solvation:
Electronic Circular Dichroism • Variable temperatuer CD spectra of an orally-bioavailable PTH mimetic peptide, showing conformational changes: 1 H-Ser-Val-Ser-Glu-Ile-Gln-Leu-Met-His-Asn-Leu-Gly-Lys-His-Leu- 16 Asn-Ser-Met-Glu-Arg-Val-Glu-Trp-Leu-Arg-Lys-Lys-Leu-Gln-Asp- 31 Val-(NH2) Anal. Chem. 2012, 84, 4357-4372, http://dx.doi.org/10.1021/ac203478r
Electronic Circular Dichroism • ECD has extensive applications to structural analysis in proteins, antibodies, and other biopolymers N. Sreerama and R. W. Woody, Meth. Enzymology, 2004, 383, 318-351.
Electronic Circular Dichroism • Different protein conformations give rise to different spectra • CD spectra are numerically fitted to extract conformational population N. Sreerama and R. W. Woody, Meth. Enzymology, 2004, 383, 318-351.
Hyphenated Circular Dichroism Experiments Example: Related atropoisomeric compounds studied in stopped-flow LC-CD experiments T. J. Edkins and D. R. Bobbitt, Anal. Chem.,2001,73, 488A-496A G. Bringmann, et al., Anal. Chem.,1999,71, 2678-2686.
The Cotton Effect • The Cotton effect: • An extrema in the ECD spectrum • Or, a zero-crossing in the ORD spectrum
Other Notes on Electronic Circular Dichroism • Background signals – UV absorbance that does not depend on the polarization constitutes the background (Dynamic Reserve). • DR = A/A = / = /(LPCL - RPCL) • is the molar absorptivity (cm-1 M-1) • A is absorption • DR values of 2 x10⁴ are possible • Electronic background suppression is almost always used instead of optical background suppression (technical design issues)
Elliptically Polarized Light • Combining left and right circularly polarized waves of unequal amplitudes = elliptically polarized light • Basis of ellipsometry – a surface analysis method used to study: • Layer/film thickness • Optical constants (refractive index and extinction coefficient) • Surface roughness • Composition • Optical anisotropy
Further Reading Optional: J. Cazes, Ed. Ewing’s Analytical Instrumentation Handbook, 3rd Edition, 2005, Marcel Dekker, Chapters 5 and 6. D. A. Skoog, F. J. Holler and S. R. Crouch, Principles of Instrumental Analysis, 6th Edition, 2006, Brooks-Cole, Chapters 13 and 14. D. H. Williams and I. Fleming, “Spectroscopic Methods in Organic Chemistry”, McGraw-Hill (1966). D. A. Lightner and J. E. Gurst, “Organic Conformational Analysis and Stereochemistry from Circular Dichroism Spectroscopy,” Wiley-VCH, 2000.