Download
1 / 25
260 likes | 507 Vues
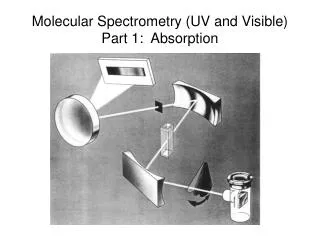
Molecular Spectrometry (UV and Visible) Part 1: Absorption. Instrument Evolution. Beckman DU. Replaced prism with grating. Turner Spectrometer. Spec 20 as well. Cary and Perkin-Elmer. Dual Beam High resolution. PDA Hewlett Packard. Fiber Optic Probes Ocean Optics.

E N D
Instrument Evolution Beckman DU
Turner Spectrometer Spec 20 as well
Cary and Perkin-Elmer Dual Beam High resolution
PDA Hewlett Packard
Fiber Optic Probes Ocean Optics
Signal Expressions Eout = Φλ (Ω/4π) Tm Ts Rλ G Φλ= source spectral power (W/nm) Tm = monochromator throughput (nm) Ts = Sample transmittance Rλ= Detector Responsivity (A/W) G = Gain of electronics (V/A)
Signal Expressions Tm = (WH/Aeff) Δλeff Top W= slit width (cm) H= slit height (cm) Aeff = Effective area of source image (cm2) Δλeff= Effective bandwitdh of the monochromator (nm) Top = Transmittance of optics
Signal Expressions Ts = e-εbc = Esam/Eref Eref = Output voltage for a blank Esam = Output voltage for sample
Signal Expressions A = -log (Esam/Eref) = -log (Ts) = ε b c Notes: 1. Since UV-Vis absorbance bands are much wider than the mono- chromator bandwidth, Beer’s Law assumes that A does not depend on Δλeff. 2. ε is wavelength dependent, but does not depend on any other instrumental parameter.
A = ε b c Design Cell to Maximize b
Deviations from Beer’s Law 1. Optical a) slit width b) wavelength selection c) stray radiation 2. Chemical a) high analyte concentration b) pH dependence c) mixtures
Deviations from Beer’s Law Slit Width
Deviations from Beer’s Law Wavelength Selection
Deviations from Beer’s Law Stray Radiation Effect No Stray Light 10% Stray Light
Deviations from Beer’s Law High Analyte Concentrations
Deviations from Beer’s Law pH Dependence
Deviations from Beer’s Law Mixtures: Absorbance is Additive
Deviations from Beer’s Law Mixtures: Solve multiple equations!
Deviations from Beer’s Law Mixtures: When all else fails, Separate the mixture components
Final Note on UV-Vis Signals The Absorbance (Analytical Signal) does not depend on the magnitude of the source signal (except for the deviations discussed above). The Noise in the measurement often DOES depend on the source signal level.