Download
1 / 11
120 likes | 215 Vues
Learn about mean, median, mode, range, quartiles, outliers, and how to compare data using box and whisker plots in algebra.

E N D
Box and Whisker Algebra I
Basic Vocabulary • Mean – sum of data divided by the total number of data. • Median – the middle number of a set of data in numerical order. • Mode – the most occurring number in a set of data. • Range – the difference between the greatest and lowest numbers in a set of data
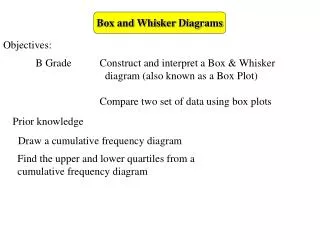
Box and Whisker Plot • Organize data in numerical order. • Find the median. • Find the median of the data between the median and the lower/upper extreme.
Parts of a Box and Whisker • Lower extreme – the lowest number on a box and whisker plot. • Upper extreme – the highest number on a box and whisker plot. • Median – the middle number on the box and whisker plot. • Upper quartile – the median of the numbers between the median and the upper extreme. • Lower quartile – the median of the numbers between the median and the lower extreme.
Example 35,35,37,40,43,56,58,58,60 • Organize data in numerical order. • Find the median (this will divide the data). • Find the median of the upper and lower sets of data.
Interquartile Range • The difference between the upper quartile and the lower quartile.
Outliers on a Box and Whisker Plot • Data that is outside of the box and whisker plot. • Shown on a graph as a point separate from the box and whisker plot.
Quartiles • Each quartile represents 25% of the data. • The interquartile represents the middle 50% of the data.
Comparing Box and Whisker • Which brand has the greater median? • Which brand has the least range?
Comparing Box and Whisker • What similarities do you see between the two tests? • What differences do you see between the two tests?
Comparing Box and Whisker • Find some comparisons between the different graphs.