Download

1 / 24
240 likes | 398 Vues
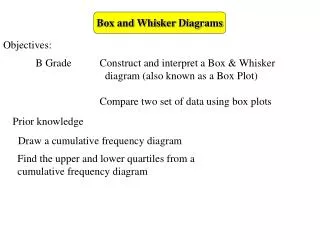
Box and Whisker Graph. Slide Presentation By Mr. Michael Braverman Trenton Public Schools March 2015. Why? To compare similar sets of data quickly and easily, even if they have different numbers of elements. Box and Whisker Graph. Box and Whisker Graph.

E N D
Box and Whisker Graph Slide Presentation By Mr. Michael Braverman Trenton Public Schools March 2015
Why? To compare similar sets of data quickly and easily, even if they have different numbers of elements. Box and Whisker Graph
Box and Whisker Graph Start with a new piece of graph paper. Draw a box and whisker graph for set C. Set C 2 5 1 9 6 6
Box and Whisker Graph Step 1: Start by ranking the data in order from lowest to highest. Set C 2 5 1 9 6 6 Set C 1 2 5 6 6 9
Step 2: Find the midway point (median) Box and Whisker Graph Set C 1 2 5 6 6 9 Median is halfway between 5 and 6.
Set C 1 2 5 6 6 9 Step 3: Find the quartiles median The median of the lower half is the lower quartile The median of the upper half is the upper quartile
Set C 1 2 5 6 6 9 Step 4: Find the ’mums LQ UQ median minimum maximum
Set C 1 2 5 6 6 9 LQ UQ median minimum Step 5: Organize your data! maximum
Step 6: Graph your data 1. Draw a number line that goes from the min to the max (it may go past them!) 0 1 2 3 4 5 6 7 8 9 10 Set C 1 2 5 6 6 9
Step 6: Graph your data 2. Draw a vertical line above the number line for each piece of data. 0 1 2 3 4 5 6 7 8 9 10 Set C 1 2 5 6 6 9
Step 6: Graph your data 3. Connect the middle three lines at the top and bottom to form a box. Set C 1 2 5 6 6 9 0 1 2 3 4 5 6 7 8 9 10
Step 6: Graph your data 4. Connect the maximum and minimum to the box in the center to form the whiskers Set C 1 2 5 6 6 9 0 1 2 3 4 5 6 7 8 9 10 Note 1: The box will ALWAYS be between the maximum and minimum, but it will not necessarily be in the center of it!
Step 6: Graph your data 4. Connect the maximum and minimum to the box in the center to form the whiskers Set C 1 2 5 6 6 9 0 1 2 3 4 5 6 7 8 9 10 Note 2: The quartiles separate the data roughly into quarters.
Step 7: “See” the fourths 0 1 2 3 4 5 6 7 8 9 10 Set C 1 256 69 1 4 1 4 1 4 1 4 Note 2: The quartiles separate the data roughly into quarters. ¼ of 6 = 1.5, so there should be one or two pieces of data per section.
Graph Multiple sets of data over the same number line to compare!
Practice Create a box and whisker graph for each of the followiing sets: D: 7 19 8 2 4 9 E: 15 13 12 14 10
Solution 7.5 D: 2 4 7 8 9 19 Min LQ Med UQ Max E: 10 12 13 14 15 11 14.5 D: 7 19 8 2 4 9 E: 15 13 12 14 10
Solution 7.5 D: 2 4 7 8 9 19 Min LQ Med UQ Max E: 10 12 13 14 15 11 14.5 D: 7 19 8 2 4 9 E: 15 13 12 14 10
Solution D: 7 19 8 2 4 9 E: 15 13 12 14 10 E D 0 2 4 6 8 10 12 14 16 18 20
E More: D 0 2 4 6 8 10 12 14 16 18 20 Suppose this is a graph of home runs hit by two different players. Why would someone argue that D was a better home run hitter? Why would someone argue that E was a better home run hitter? Who would you pick for your team? Why? What other questions would you need to answer before you make that decision?
Outliers 1. Data far enough away from the rest of the data to distort the “average” 2. Data more than 1.5 times the Interquartile range above the upper quartile or belowthe lower quartile.
Outliers Data more than 1.5 times the Interquartile rangeabove the upper quartile or below the lower quartile. Interquartile Range = the distance between the Upper Quartile and Lower Quartile IQR = UQ - LQ IQR = 9 - 4 = 5 IQR D 0 2 4 6 8 10 12 14 16 18 20
Outliers Data more than 1.5 times the Interquartile range above the upper quartile or below the lower quartile. IQR = 5 1.5 * IQR = 1.5 * 5 = 7.5 9 + 7.5 = 16.5 -3.5 = 4 - 7.5 IQR IQR IQR D 0 2 4 6 8 10 12 14 16 18 20 The UPPER BORDER for outliers is 16.5. The LOWER BORDER for outliers is -3.5
Outliers D 0 2 4 6 8 10 12 14 16 18 20 The UPPER BORDER for outliers is 16.5. The LOWER BORDER for outliers is -3.5 Data more than 1.5 times the Interquartile range above the upper quartile or below the lower quartile. Therefore, any data above 16.5 is an outlier. Note that since The maximum is higher than 16.5, we have at least one outlier. There are no outliers at the lower end because the minimum is higher than the LOWER BORDER