Download
1 / 43
440 likes | 595 Vues
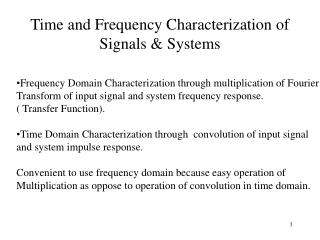
Frequency and time dependece of signals. Frequency Domain Spectroscopy – radiant power data are recorded as a function of frequency (or wavelength). Time Domain Spectroscopy – concerned with changes in radiant power with time. Achieved by Fourier transform.

E N D
Frequency and time dependece of signals Frequency Domain Spectroscopy – radiant power data are recorded as a function of frequency (or wavelength). Time Domain Spectroscopy – concerned with changes in radiant power with time. Achieved by Fourier transform. Chemistry Department, University of Isfahan
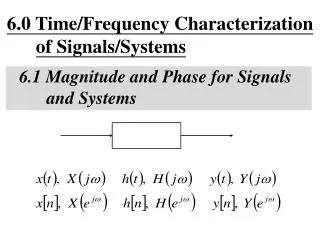
Non-Dispersive Methods • Fourier-Transform Interferometry What if we could measure the oscillating wavefunction of EMR directly? Fourier Transform Time Domain Frequency Domain Chemistry Department, University of Isfahan
Fourier composition of a square wave Chemistry Department, University of Isfahan
Direct Measurement:Feasible? • Suppose we had EMR with λ = 10 μm That’s 1 cycle every 33 x 10-15 s (33 femtoseconds!) Upshot: we can’t measure the oscillating EMR field directly for opticalradiation Chemistry Department, University of Isfahan
High Freq. ~ 1013 Hz Low Freq. ~ 102 Hz Interfer- ometer Detector Computer h h @ f Enter Interferometry • We need a signal that is much slower, so • that it can be measured . . . How? Chemistry Department, University of Isfahan
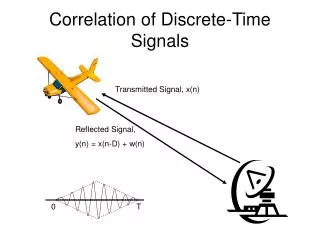
Michelson Interferometer Movable mirror Beam splitting mirror Source Fixed Mirror Detector l -1 1 3 2
Resulting Interferogram • δ = pathlength difference • (retardation) • δ = 2(M-F) • δ = 2x (mirror displacement) So, we get maxima when δ = nλ and minima when δ = ½nλ (recall that the actual mirror movement is ½δ) Chemistry Department, University of Isfahan
Modulation Frequency • Moving Mirror moves continuously at a fixed • velocity (VM), so the signal at the detector will • oscillate at a related frequency (f): f = 2VM/λ Or: f = (2VM/c)ν If VM = 0.1 cm/s, λ = 10 μm EMR will be modulated at: f = 2(1.0 x 10⁻³ m/s)/(10 x 10-6 m) = 200 Hz Chemistry Department, University of Isfahan
To the Frequency Domain! Chemistry Department, University of Isfahan
Chemistry Department, University of Isfahan From Interferogram toSpectrum
Why Bother withFT-Interferometry? • 1. Signal-to-Noise Enhancement • Multiplex Advantage (“Fellgett’s Advantage”) • -All wavelengths viewed simultaneously, so • measurement time/resolution element is • greater • If measurement is limited by detector noise: • S/N enhancement ∝ (n)1/2 • where n = number of resolution elements Chemistry Department, University of Isfahan
Multiplex Advantage: Time • Suppose we spent 6000 seconds acquiring the • spectrum and we really don’t need the enhanced • S/N: • We can get the same S/N as with a dispersive system in 1/(n)1/2 of the time • In this case, this means it would take: • 6000 s/54.8 ≈ 110 s So, 100 minutes (dispersive) versus 2 minutes (FT-interferometry)! Chemistry Department, University of Isfahan
Summary of Advantages of Fourier Transform Spectroscopy Fellgett Advantage – all of the resolution elements for a spectrum are measured simultaneously, thus reducing the time required to derive a spectrum at any given signal-to-noise ratio. Jacquinot Advantage – the large energy throughput of interferometric instruments (which have few optical elements and no slits to attenuate radiation. High wavelength precision, making signal averaging feasible. Ease and convenience that data can be computer-manipulated. Chemistry Department, University of Isfahan
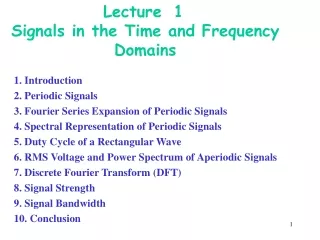
Optical instrument Five components 1. a stable source of radiant energy 2. a transparent container for holding the sample 3. a device that isolates a restricted region of the spectrum for measurement 5. a signal processor and Fiber Optics 4. a radiation detector Chemistry Department, University of Isfahan
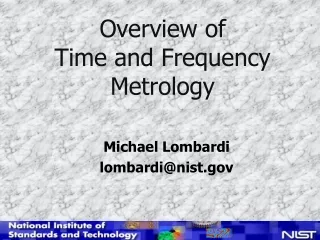
Detectors for spectroscpic instruments , nm 100 200 400 700 1000 2000 4000 7000 10,000 20,000 40,000 VAC UV VIS Near IR IR Far IR Spectral region Detectors Photographic plate Photomultiplier tube Phototube Photon detectors Photocell Silicone diode Charge transfer detector Photoconductor Thermocouple (voltage) or barometer (resistance) Golay pneumatic cell Thermal detectors Pyroelectric cell (capacitance) Chemistry Department, University of Isfahan
Radiation Detectors • Detectors convert light energy to an electrical signal. • In spectroscopy, they are typically placed after a wavelength separator to detect a selected wavelength of light. • Different types of detectors are sensitive in different parts of the electromagnetic spectrum. Chemistry Department, University of Isfahan
Ideal Detectors • high sensitivity • high S/N ratio • constant response over a considerable range of • fast response • minimum output signal in the absence of illumination (low dark current) • electric signal directly proportional to the radiation power ? S =kP + kd dark current radiation power (intensity) Chemistry Department, University of Isfahan
Types of radiation detectors Two major types: one responses to photons, the other to heat • photon detectors: UV, visible, IR • (when used for 3 µm or longer , cooling to dry ice or liquid nitrogen is necessary to avoid interference with thermal signal) • signal results from a series of individual events • shot noise limited • thermal detectors: IR • signal responds to the average power of the incident radiation • thermal noise limited Chemistry Department, University of Isfahan
Photon detectors (a) Photovoltaic cells: radiant energy generates a current at the interface of a semiconductor layer and a metal; (b) Phototubes: radiation causes emission of electrons from a photosensitive solid surface; (c) Phtomultiplier tubes: contain a photoemissive surface as well as several additional surfaces that emit a cascade of electrons when struck by electrons from the photosensitive area; (d) Photoconductivity detectors: absorption of radiation by a semiconductor produces electrons and holes, thus leading to enhanced conductivity; (e) Silicon photodiods: photons increase the conductance across a reverse biased pn junction. Used as diode array to observe the entire spectrum simultaneously • Multichannel photon detector Chemistry Department, University of Isfahan
Barrier Layer Cell Thin layer of silver Glass Selenium Plastic case Iron - +
V Photoelectric Effect
Cathode Wire anode 90 Vdc
Vacuum Phototubes • The number of electrons ejected from a photoemissive surface is directly proportional to the radiant power of the beam striking that surface; • As the potential applied across the two electrodes of the tube increases, the fraction of the emitted electrons reaching the anode rapidly increases; • when the saturation potential is achieved, essentially all the electrons are collected at the anode. • The current then becomes independent of potential and directly proportional to radiation power. Chemistry Department, University of Isfahan
Photomultiplier Tube + _ Dynode Potential(V) Number of electrons 1 90 10 5 2 180 100 7 3 3 270 103 4 6 4 360 104 2 1 5 450 105 8 6 540 106 9 7 630 107 Quartz envelope Anode Grill 8 720 108 9 810 109 Photoemissive Cathode Anode 900V Gain =108 900V dc Photoemissive Cathode Dynodes 1-9 Anode To readout
Features of Photomplier Tubes • High sensitivity in UV, Vis, and NIR • Limited by dark current • Cooling to -30oC improves response • Extremely fast time response • Limited to measuring low-level signals
Silicon Diode pn junction Metal contact Lead wire n region p region Fig. 7.30
Silicon diode under Revese Bias Reverse bias Depletion layer
Forward bias e e Silicon Diode under Forward Bias
Photodiode and Photovoltaic Detectors • When a photon strikes a semiconductor, it can promote an electron from the valence band (filled orbitals) to the conduction band (unfilled orbitals) creating an electron(-) - hole(+) pair. • The concentration of these electron-hole pairs is dependent on the amount of light striking the semiconductor, making the semiconductor suitable as an optical detector. Chemistry Department, University of Isfahan
Semiconductor Detector A reverse-biased linear diode-array detector: (a) cross section and (b) top view. Chemistry Department, University of Isfahan
Multichannel Photon Detector Photodiode Arrays Charge-injection devices Charge-coupled devices (CCDs) Chemistry Department, University of Isfahan
Photodiode Array Detectors (PDA) • A photodiode array (PDA) is a linear array of discrete photodiodes on an integrated circuit (IC) chip. • For spectroscopy it is placed at the image plane of a spectrometer to allow a range of wavelengths to be detected simultaneously. • In this regard it can be thought of as an electronic version of photographic film. • Array detectors are especially useful for recording the full uv-vis absorption spectra of samples that are rapidly passing through a sample flow cell, such as in an HPLC detector. Chemistry Department, University of Isfahan
Diode Array Detectors • Advantage • speed • sensitivity • The Multiplex advantage • Disadvantage • resolution is 1 nm, vs 0.1 nm for normal UV
Optical instrument • Five components • 1. a stable source of radiant energy • 2. a transparent container for holding the sample • 3. a device that isolates a restricted region of the • spectrum for measurement • 4. a radiation detector 5. a signal processor and Fiber Optics Chemistry Department, University of Isfahan
Signal processing • An electronic device that amplifies the electric • signal from the detector • photon counting: • has a number of advantages over analog signal: • improved S/N • sensitivity to low radiation level • improved precision for a given time measurement time Chemistry Department, University of Isfahan
Fiber Optics The field of fiber optics depends upon the total internal reflection of light rays traveling through tiny optical fibers. Once the light is introduced into the fiber, it will continue to reflect almost losslessly off the walls of the fiber and thus can travel long distances in the fiber. Bundles of such fibers can accomplish imaging of otherwise inaccessible areas. Chemistry Department, University of Isfahan
Fiber optic • Optical fibers are circular dielectric waveguides that can transport optical energy and information. • They have a central core surrounded by a concentric cladding with slightly lower (about 1%) refractive index. • Fibers are typically made of silica with index modifying dopants such as GeO2. • total internal reflection • incident angle larger than critical angle • core material: n1; cladding material: n2 • n1 > n2 for total internal reflection • numerical aperture: a measure of the magnitude of the light gathering ability of the fiber. It also indicates how easy it is to couple light into a fiber. Chemistry Department, University of Isfahan
Fiber Optics • Good for transmission of light over long distances • Flexible Chemistry Department, University of Isfahan
Chemistry Department, University of Isfahan Fiber Optics