Download
1 / 25
250 likes | 387 Vues
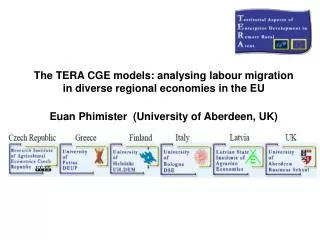
The TERA CGE models: analysing labour migration in diverse regional economies in the EU Euan Phimister (University of Aberdeen, UK). SAM & General Equilibrium models Major Part of TERA project This Presentation and Next Complementary Aim - motivation, implementation, usefulness

E N D
The TERA CGE models: analysing labour migration in diverse regional economies in the EU Euan Phimister (University of Aberdeen, UK)
SAM & General Equilibrium models • Major Part of TERA project • This Presentation and Next Complementary • Aim - motivation, implementation, usefulness Structure • Background • Case Study Areas • Modelling Approach SAMs and CGE Models • Model Structure • Using Models - labour migration.
Background TERA: Economic development in remote rural areas Aims: • Role territorial factors which influence development • review whether existing policies take account of factors • propose new policy interventions. “The trends and choices that affect rural areas cannot be studied in isolation from what is going on in non-rural areas” (Saraceno, 1994)
Approach • Regional/Local • Modelling within region rural-urban linkages 6 Case Study areas. Reflect different • Economic and Institutional Context • Spatial Scale • Rural-urban relationship
Case Study Differences Spatial Scale NUTS3 to NUTS 4/5 Population levels 110K – 400K Rural Pop Densities - 9.5 - 125 persons/km squared (Finland) –(Italy) Economic Size 0.5bn - 2bn euros/year GDP per capita. Developed (UK) – less developed (Latvia) Rural share of GDP – 5% (Greece) to 60%(Finland)
Modelling • Social Accounting Matrices (SAM) - all transactions given point in time • SAM - basis for Computable Equilibrium Model (CGE) SAM Construction - each study area • Existing secondary sources, e.g. national input-output tables • Primary Data collection • Survey of Households and Business survey, interviews with key informants
Computable Equilibrium Model (CGE) Behaviour of representative agents in economy • Producers and Traders – maximise profits • Consumers – maximise their well-being (have demand curves) • Government collects taxes and makes transfers (tax rates and transfers are exogenously set) Model Closure rules – assumptions on how markets operate e.g. labour All transactions in “economy” accounted for. TERA-CGE Models • IFPRI Standard CGE Model (Lofgren et al) (www.ifpri.org/pubs/microcom/micro5.htm ) • Disaggregation of Accounts allows rural-urban analysis
Production structure Local/Regional Urban/Rural Urban/Rural Local/Regional
CGE Model Estimation • Each case study area • Data - SAM plus other literature estimates • Procedure - calibrate CGE models so each CGE replicates Case study SAM CGE Model Usefulness • Full Picture of case-study economic transactions • Controlled experiments – what if ? Example Simple Scenario – labour migration • How different are the effects of large labour inflow/outflows in case study areas?
Case Study Areas Evidence • Significant Growth Greek, Scottish Study areas • Decline Finnish and Latvian areas Composition effect ? • Finland - outmigration of highly educated people • Scotland- in migrants (skilled) but work in low skilled occupations Scenario 1 + 10% change in total labour supply all areas Scenario 2 • -20% skilled labour category Czech R, Finland, Latvia • +20% unskilled labour category Greece, Italy, UK Key Assumptions Each case study area separate labour market Urban-rural labour market integrated within case study area Capital fixed by sector, Government spending fixed
Scenario 1 +10% change in total labour supply all areas Aggregate level (GDP) broadly similar effects across case study areas +10% positive impact 5-8% (-10% approximately same negative effect) Components of GDP - Larger differences Rural-urban decomposition +10% positive impact Rural GDP effects 2-9% Mostly Rural same or less than Urban effect (except Italy) Largest differences GR, UK Rural-urban sectoral decomposition +10% positive impact Mostly Rural sectoral effect same or less than Urban effect(except Italy) Largest differences GR, UK
Scenario 2a) -20% skilled labour category Czech R, Finland, Latvia b) +20% unskilled labour category Greece, Italy, UK Areas losing skilled labour Big differences in overall loss 5-12.6% Urban areas worst hit Broadly, impact by sector comparable Areas gaining unskilled labour Some differences in overall gains 2-4% No clear pattern whether Urban or rural areas gain most Differential sectoral impact by rural-urban Ratio Skilled: unskilled wages increases both losing & gaining areas
Scenario 2a) -20% skilled labour category Czech R, Finland, Latvia b) +20% unskilled labour category Greece, Italy, UK
Summary & Conclusions • Modelling Approach SAMs and CGE • CGE Models capture Case Study areas differences (?) • Labour migration General – Rural GDP case study area differences Urban effect often bigger than Rural Skills mix- differential losses and gains • Example CGE - What if? • Further simulations – tailored to specific circumstances of each case study area • Range simulations envisaged – Tourism, Transport, Agric Policy