The Open Economy Chapter 8 - Mankiw
370 likes | 953 Vues
The Open Economy Chapter 8 - Mankiw. Until now: closed economy In reality, most economies are open : - export goods and services abroad - import goods and services from abroad - borrow and lend in financial markets Some empirical evidence:

The Open Economy Chapter 8 - Mankiw
E N D
Presentation Transcript
The Open Economy Chapter 8 - Mankiw
Until now: closed economy In reality, most economies are open: - export goods and services abroad - import goods and services from abroad - borrow and lend in financial markets Some empirical evidence: - in US, imports and exports are about 13% of GDP - in Canada and United Kingdom, imports and exports are over 30% of GDP - in Netherlands or Belgium (smaller countries), exports are more than 50% of GDP
1) How to measure the interactions among countries (flows of goods and services and flows of funds) (the accounting identities) 2) The determinants of these international flows (a model of a small open economy) This part: Open-Economy Macroeconomics 3)Exchange rates (the prices at which a country makes exchanges in the world markets)
Closed economy - all output is sold domestically - expenditure is divided into: consumption (C) investment (I) government purchases (G) Open economy - some output is sold domestically and some is exported to be sold abroad - expenditure is divided into: consumption (Cd) investment (Id) government purchases (Gd) exports of domestic goods and services (EX) 1. The international flows of capital and goods
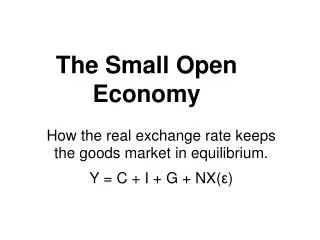
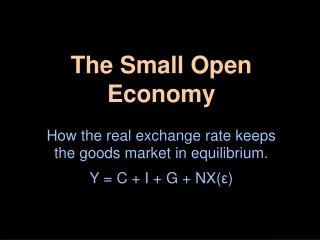
Total demand for domestic output Investment spending by businesses and households is composed of Net exports or net foreign demand Government purchases of goods and services Consumption spending by households National Income Accounts Identity in an Open Economy Y = C + I + G + NX Notice we’ve added net exports, NX, defined as EX-IM. Also, note that domestic spending on all goods and services is the sum of domestic spending on domestic goods and services and on foreign goods and services.
Net Exports Domestic Spending Output Y = C + I + G + NX After some manipulation, the national income accounts identity can be re-written as: NX = Y - (C + I + G) This equation shows that in an open economy, domestic spending need not equal the output of goods and services. If output exceeds domestic spending, we export the difference: net exports are positive. If output falls short of domestic spending, we import the difference: net exports are negative.
Let’s call this S, national saving (Review Chapter 3!!). Trade Balance (net exports) Net Foreign Investment Net Foreign Investment & the Trade Balance Start with the national income accounts identity. Y=C+I+G+NX. Subtract C and G from both sides and obtain Y-C-G = I+NX. So, now we have S=I+NX. Subtract I from both sides to obtain the new equation, S-I=NX. This form of the national income accounts identity shows that an economy’s net exports must always equal the difference between its saving and its investment. S-I=NX
Net Capital Outflow =Trade Balance S-I=NX It reflects the international flow of funds to finance capital accumulation If S-I and NX are positive, we have a trade surplus. We would be net lenders in world financial markets, and we are exporting more goods than we are importing. If S-I and NX are negative, we have a trade deficit. We would be net borrowers in world financial markets, and we are importing more goods than we are exporting. If S-I and NX are exactly zero, we have balanced trade since the value of imports equals the value of exports.
2. Saving and Investment in a Small Open Economy Until now, we have just defined some of the variables that measure interactions among countries. We are now going to develop a model of the international flows of capital and goods, that will explain the behavior of these variables. Then, we’ll address issues such as how the trade balance responds to changes in policy.
Capital Mobility and the World Interest Rate - We’ll borrow a part of the model from Chapter 3, but won’t assume that the real interest rate equilibrates saving and investment. - Instead, we’ll allow the economy to run a trade deficit and borrow from other countries, or to run a trade surplus and lend to other countries. Assumptions: - Consider a small open economy with perfect capital mobility, which it takes the world interest rate r* as given, denoted r = r*. -Our small open economy takes the world interest rate as an exogenously given variable
The Model The economy’s output Y is fixed by the factors of production and the production function. Y = Y = F(K,L) Consumption is positively related to disposable income (Y-T). C = C (Y-T) Investment is negatively related to the real interest rate. I = I (r) The national income accounts identity, expressed in terms of saving and investment. NX = (Y-C-G) - I or NX = S - I Now substitute our three assumptions from Chapter 3 and the condition that the interest rate equals the world interest rate, r*. NX = (Y-C(Y-T) - G) - I (r*) NX = S - I (r*) This equation suggests that the trade balance is determined by the difference between saving and investment at the world interest rate.
Real interest rate, r* In a closed economy, r adjusts to equilibrate saving and investment. S NX In a small open economy, the interest rate is set by world financial markets. The difference between saving and investment determines the trade balance. r* rclosed r*' I(r) NX Investment, Saving, I, S Saving and Investment in a Small Open Economy In this case, since r* is above rclosed and saving exceeds investment, there is a trade surplus (S>I). If the world interest rate decreased to r* ', I would exceed S and there would be a trade deficit (S<I).
How Policies Influence the Trade Balance? The impact of economic policies on the trade balance the impact of economic policies on domestic saving and domestic investment. We will consider the following three situations: - a domestic fiscal expansion - a fiscal expansion abroad - a shift in the investment demand
Real interest rate, r* S S' NX = (Y-C(Y-T) - G) - I (r*) NX = S - I (r*) The result is a reduction in national saving which leads to a trade deficit, where I > S. r* I(r) Investment, Saving, I, S NX A Domestic Fiscal Expansion in a Small Open Economy Suppose: the economy begins in a position of balanced trade. An increase in (domestic) government purchases or a cut in taxes decreases national saving and thus shifts the national saving schedule to the left.
Real interest rate, r* S The higher world interest rate reduces investment in this small open economy, causing a trade surplus where S >I. r1* r2* I(r) Investment, Saving, I, S NX A Fiscal Expansion Abroad in a Small Open Economy What happens to a small open economy when foreign governments increase their government purchases? - If these countries are large enough to influence world saving and investment then the world interest rate raises from r1* to r2*.
As a result, investment now exceeds saving I >S, which means the economy is borrowing from abroad and running a trade deficit. Real interest rate, r* S r1* I(r)2 I(r)1 NX Investment, Saving, I, S A Shift in the Investment Schedule in a Small Open Economy An outward shift in the investment schedule from I(r)1 to I(r)2 increases the amount of investment at the world interest rate r*.
To summarize: • Policies that decrease saving or increase investment tend to cause a trade deficit • Policies that increase saving or decrease investment tend to cause a trade surplus
3. Exchange rates In the next few slides, we’ll learn about the foreign exchange market, exchange rates and much more!
The Mechanics of the Foreign Exchange Market - two countries (US and Japan) engage in trade: different cultures, languages, and currencies, all of which could hinder trade. - because of the foreign exchange market, trade transactions become more efficient. - The foreign exchange market is a global market in which banks are connected through high-tech telecommunications systems in order to purchase currencies for their customers.
In order for the U.S to pay for its imports of goods and services and securities from Japan, GOODS & SERVICES & Securities DemandYEN Supply$ U.S. Japan SupplyYEN Demand$ Goods and Services & SECURITIES The Foreign Exchange Market it must supply dollars which are then converted into yen by the foreign exchange market. Foreign Exchange Market In order for Japan to pay for its imports of goods and services and securities from the U.S., it must supply yen which are then converted into dollars by the foreign exchange market.
Nominal vs. real Exchange Rates The exchange rate between two countries is the price at which residents of those countries trade with each other.
-relative price of the currency of two countries -denoted as e Nominal Exchange Rate -relative price of the goods of two countries -sometimes called the terms of trade -denoted as e Real Exchange Rate
Nominal Exchange Rate, e The nominal exchange rateis the relative price of the currency of two countries. For example, if the exchange rate between the U.S. dollar and the Japanese yen is 120 yen per dollar, then you can exchange 1 dollar for 120 yen in world markets for foreign currency. A Japanese who wants to obtain dollars would pay 120 yen for each dollar he bought. An American who wants to obtain yen would get 120 yen for each dollar he paid. When people refer to “the exchange rate” between two countries, they usually mean the nominal exchange rate.
e Real Exchange Rate, The real exchange rate is the relative price of the goods of two countries. The real exchange rate tells us the rate at which we can trade the goods of one country for the goods of another. The difference between the real and nominal exchange rates: - consider a single good produced in many countries: cars. -suppose an American car costs $10,000 and a similar Japanese car costs 2,400,000 yen. - if a dollar is worth 120 yen, then the American car costs 1,200,000 yen. - Comparing the price of the American car (1,200,000 yen) and the price of the Japanese car (2,400,000 yen), we conclude that the American car costs one-half of what the Japanese car costs. - In other words, at current prices, we can exchange 2 American cars for 1 Japanese car.
e Real Exchange Rate, We can summarize our calculation as follows: Real Exchange Rate = (120 yen/dollar) (10,000 dollars/American car) (2,400,000 yen/Japanese Car) = 0.5 Japanese Car American Car At these prices, and this exchange rate, we obtain one-half of a Japanese car per American car. More generally, we can write this calculation as Real Exchange Rate = Nominal Exchange Rate Price of Domestic Good Price of Foreign Good The rate at which we exchange foreign and domestic goods depends on the prices of the goods in the local currencies and on the rate at which the currencies are exchanged.
Relationship between the real and nominal exchange rate e = e × (P/P*) Nominal Exchange Rate Ratio of Price Levels Real Exchange Rate Note: P is the price level of the domestic country (measured in the domestic currency) and P* is the price level of the foreign country (measured in the foreign currency).
e = e × (P/P*) Real Exchange Rate Nominal Exchange Rate Ratio of Price Levels The real exchange rate between two countries is computed from the nominal exchange rate and the price levels in the two countries. If the real exchange rate is high, foreign goods are relatively cheap, and domestic goods are relatively expensive. If the real exchange rate is low, foreign goods are relatively expensive, and domestic goods are relatively cheap.
S-I Real exchange rate, e The real exchange rate is determined by the intersection of the vertical line representing saving minus investment and downward-sloping net exports schedule. Here the quantity of dollars supplied for net foreign investment equals the quantity of dollars demanded for the net exports of goods and services. NX(e) 0 Net Exports, NX The Real Exchange Rate and the Trade Balance The relationship between the real exchange rate and net exports is negative: the lower the real exchange rate, the less expensive are domestic goods relative to foreign goods, and thus the greater are our net exports.
S1-I Real exchange rate, e The fall in saving reduces the supply of dollars to be exchanged into foreign currency, from S1-I to S2-I. This shift raises the equilibrium real exchange rate from e1 to e2. A reduction in saving reduces the supply of dollars which causes the real exchange rate to rise and causes net exports to fall. NX1 Net Exports, NX The Impact of Expansionary Fiscal Policy at Home on the Real Exchange Rate S2-I Expansionary fiscal policy at home, such as an increase in government purchases G or a cut in taxes, reduces national saving. e2 e1 NX(e) NX2
S-I (r2*) Real exchange rate, e The increase in the world interest rate reduces investment at home, which in turn raises the supply of dollars to be exchanged into foreign currencies. NX(e) NX2 Net Exports, NX The Impact of Expansionary Fiscal Policy Abroad on the Real Exchange Rate Expansionary fiscal policy abroad reduces world saving and raises the world interest rate from r1* to r2*. S-I(r1*) e1 e2 As a result, the equilibrium real exchange rate falls from e1 to e2. NX1
S-I1 Real exchange rate, e As a result, the supply of dollars to be exchanged into foreign currencies falls from S-I1 to S-I2. NX(e) NX1 Net Exports, NX The Impact of an Increase in Investment Demand on the Real Exchange Rate An increase in investment demand raises the quantity of domestic investment from I1 to I2. S-I2 e2 This fall in supply raises the equilibrium real exchange rate from e1 to e2. e1 NX2
Purchasing Power Parity The law of one price - the same good cannot sell for different prices in different locations at the same time Purchasing Power Parity - the law of one price applied to the international market place - It states that if international arbitrage is possible, then a dollar must have the same purchasing power in every country. - Purchasing Power Parity does not always hold because some goods are not easily traded, and sometimes traded goods are not always perfect substitutes– but it does give us reason to expect that fluctuations in the real exchange rate will be small and short-lived.
Purchasing Power Parity The law of one price applied to the international marketplace suggests that net exports are highly sensitive to small movements in the real exchange rate. This high sensitivity is reflected here with a very flat net-exports schedule. Real exchange rate, e S-I NX(e) Net Exports, NX
Key Concepts of Ch. 8 Net exports Trade balance Net capital outflow Trade surplus and trade deficit Balanced trade Small open economy World interest rate Nominal exchange rate Real exchange rate Purchasing-power parity