Download
1 / 70
920 likes | 1.58k Vues
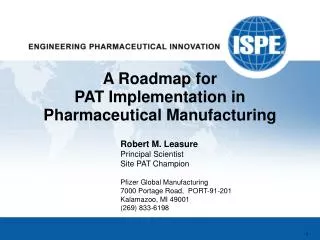
A Roadmap for PAT Implementation in Pharmaceutical Manufacturing. Robert M. Leasure Principal Scientist Site PAT Champion Pfizer Global Manufacturing 7000 Portage Road, PORT-91-201 Kalamazoo, MI 49001 (269) 833-6198. Presentation Outline. Provide some Definitions about PAT

E N D
A Roadmap forPAT Implementation in Pharmaceutical Manufacturing Robert M. Leasure Principal ScientistSite PAT Champion Pfizer Global Manufacturing7000 Portage Road, PORT-91-201Kalamazoo, MI 49001(269) 833-6198
Presentation Outline • Provide some Definitions about PAT • But in the process more Questions will be asked than definitions provided. • Asking the right Questions provides the framework for successful implementations. • Site perspective of a PAT program • Project Selection • Resource Allocation – from site and center support • Steps for Implementation • Examples of PAT Implementations in Kalamazoo Manufacturing Ops • Drug ProductParental Sterile Suspension - improved content uniformity • Drug ProductDissolution Monitoring of Active during pH adjustment • API OperationsSolvent Recovery – improved yield from timely fraction determination.
Definitions and Questions What is PAT? Process Analytical Technologies Things that come to mind….. Questions that come to mind….. • Where are you going to stick that probe? • How are you going to validate that system? • What are you going to do with that data? • Probes in TanksAnalyzers in Plant • Automation • Process Data (lots of it)
What is PAT? Technologists Managers Support Groups Quality andRegulatory Groups The answer is multivariate and transient. It depends on who is asking the question, and who is giving the answer. $$$ IT,Engineering, Maintenance
What is (a) PAT? On-line Bona fideOn-linePAT System Fiber-Optic Probe pH Probe Near-Infrared Analog Recorder Spectrometer FeedbackControl At-line Off-line Automation vs.
FDA Guidance on PAT FDA Guidance Document on PAT Released in September 2004. http://www.fda.gov/cder/guidance/6419fnl.htm Ajaz S. Hussain, Ph.D. Previously Deputy Directory Office of Pharmaceutical Science, CDER, FDA Key proponent for the use of PAT inthe pharmaceutical industry.
FDA Definition of PAT • FDA Guidance – September 2004PAT – A Framework for Innovative Pharmaceutical Manufacturing and Quality Assurance • Line 158:“For the purposes of this guidance document, PAT is considered to be a system for designing, analyzing, and controlling manufacturing through timely measurements (i.e., during processing) of critical quality and performance attributes of raw and in-process materials and processes with the goal of ensuring final product quality.” • Line 158:“For the purposes of this guidance document,PAT isconsidered to bea system for designing, analyzing, and controlling manufacturing through timely measurements (i.e., during processing) ofcritical quality and performance attributesof raw and in-process materials and processeswith the goal of ensuring final product quality.”
Who benefits from (a) PAT? What is (a) PAT? The Users $$$ Technologists Managers IT,Engineering, Maintenance Support Groups Quality andRegulatory Groups 1. Manufacturing Operations 2. R&D or Process Scientists
Where does PAT begin (and end)? ManufacturingOperations R&D or Process Support PAT Project Progression Involvement Co-development or Continuous Improvement Activities * Proceed with PATs in development? "Early PAT" • Used to determineCritical Process Parameters "Late PAT" • Used to control the process • Requires formal validation • Low cost / benefit ratio
Why do PAT? Improved quality. Improved safety. Cost savings. Improved quality. Improved safety. Cost savings. Improved quality. Improved safety. Cost savings. RFT Well Controlled Process Fundamental Goals Process Control Process Knowledge
Continuous Quality Verification Inputs Metrics People Cost Equipment Schedule Procedures Quality (Compliance) Materials D Data Root Cause Analysis Action Requirements Process What is done on the plant floor. Process Analytics Evaluation Well Controlled Process Model
Use of PAT to Achieve RFT Benefits • Reduce/eliminate deviations • Improve customer service (product availability) • Reduce cycle times (operational efficiency) • Reduce inventory levels • Reduce costs (reworks, resample, retesting, etc) • Improve capacity utilization • Improve compliance (reduce deviation reports) • Improve assurance of quality Reduced need for end product testing is a potential consequence of RFT performance, but is not the direct goal of Pfizer’s PAT strategy.
Six Questions ? do you want to measure? Chemical or physical property. • How ? • What Analytical technology. do you want to measure it? • Why ? Process Knowledge or Process Control? do you want to measure it? • Where ? do you want to measure? Before, during, or after a process step? • When ? Sampling frequency. do you want to measure it? • Who ? Validation….. will look at the results?
Considerations for Project Identification • Is the process “broken”?Are there unknown or unmeasured critical process parameters? • How big is the problem?What are the risks of non-conformance?What is the cost of poor throughput? • Where should the measurement be made?At-line or On-line? (On-line is usually > 3x more $.)Are there area classification requirements? i.e., Class I Div I • How often should a measurement be made?What are the process and instrument limitations? • What decisions will be made with the data?Does Quality Operations want to intimately know the process? What are the Regulatory implications? • Will implementation affect other processes?What is the impact on Cleaning Validation and probematerial of construction compatibility?
PAT System Qualification • PAT System Qualification and Method Validationshould be based on intended use of data. Three Levels 1. Development or Proof of Concept 2. Information Only 3. Release Decisions Quality Impact No Impact Indirect Impact Direct Impact • Validation or Commissioning and Qualificationmust conform to applicable: • Corporate Quality Standards • Site Procedures
Quality Impact Assessments • Process Knowledge • No Impact or Indirect Impact (validation perspective) • Short term study used to assess process variability,and potential need for a permanent PAT • Process Monitoring • Indirect Impact, requiring “Commissioning of Equipment” • More permanent implementation. • Monitors process to assure RFT, but not used for decision making; i.e., registered or validated assay already exists. • Process Control • Direct Impact, requiring “Qualification of Equipment” • Used for • Material Release or Parametric Release • GMP Decisions for Critical to Process Parameters (CPP) • Advanced Process Control
PAT Development Resources for Kalamazoo Two main manufacturing operations: Active Pharmaceutical Ingredients Drug Product • Fermentation Operations • Chemical Operations • Sterile Injectables • Non-sterile Fluids and Ointments Site Technology Groups Kalamazoo ProcessTechnology (KPT) Product and ProcessTechnology (PPT) Right First Time (Black, Green, Yellow Belts) Site PAT Group Process AnalyticalSupport Group (PASG) Center Function Support
Site Implementation Plan (SIMP) • Updated annually, by PAT Champion. • High level plan extending out 3 years. • Approvals • Site Leadership Team (KLT) and KPT &PPT Management • US Area RFT Team Lead • PASG Implementation Team Lead • Purpose • Track existing PAT projects • Identify potential new projects • Prioritize new and existing projects • Implementation Timing • Resource Allocation
Technology Development Process Plant POC Report DevelopmentCPA(if needed) SIMP Site Imple-mentation Plan Tech Report on Lab POC Studies PAT Project Charter Project specific teamorganized Justificationreview andprojectprioritization Lab proof ofconcept Plant proof ofconcept Decision toproceed PAT Project Ideas ProductionQuality OperationsEHSTechnology GroupsAutomationEngineering PAT Champion PAT ChampionPASGTech GroupsVendor PAT ChampionProductionQuality OpsEHSTech GroupsAutomationEngineering Project TeamPASGVendor Project TeamSite ManagementPASG Adapted from an illustration by Seamus O’Neill (PASG, Ireland)
PAT ImplementationTeam Implementation of a PAT requires input from a multi-disciplinary team. PATChampion Maintenance RFTChampion Management Validation Services Information Technology ManufacturingOperations PATProject Automation Tech Services(KPT or PPT) Engineering R&D (co-dev) PASG Environmental,Health and Safety QualityOperations Regulatory
GAMP Model for Instrument Qualification Good Automated Manufacturing Practice User Requirements Performance Qualification Functional Specifications Operational Qualification Design Specifications Installation Qualification Installation
More Questions What are you going to do with the data? • Is the information used for material release? • Do components come into direct contact with product? • Is there a GMP Impact? • Is there a Regulatory Impact? • Does the system affect product quality? • What if the system fails? • How should the data be archived? • Etcetera (ca. 14 questions for a system level impact assessment) Really asking:Is the PAT for Process Knowledge or Process Control ? Answer: Quality Impact Assessment document
Implementation Process QIAQualityImpactAssessment URSUser RequirementsSpecifications PQ Performance Qualification IQ/OQ Installation and Operation Qualification FDS FunctionalDesignSpecifications DefinitiveCPACapital ProjectApproval • Lifecycle Docs • Analytical Methods • Operation SOPs • Maintenance SOPs • Training Docs • Change Control • Periodic Review • Business Continuity Plan DefineRequirements Cost review, justification, vendor selection,and approval FAT, SAT, installation,qualification Applicationverification Routine Operation Ready forRoutineOperation? Cross SiteLearning PAT TeamPASG Project TeamPASGVendor Vendor Project TeamPASGValidation Services ProductionQualityPAT Champion Adapted from an illustration by Seamus O’Neill (PASG, Ireland)
Example #1 – CU in a Sterile Suspension • Application: Drug Product Sterile Aqueous Suspension • Quality Impact: No Impact, Process Knowledge (product was not for sale) • Objective: Improved Content Uniformity during later stages of filling operation. • Project: RFT and Continuous Improvement Black Belt project to provide suggested process changes for improved content uniformity.
Drug Product – Sterile Injectable • Parenteral Suspension • Solid • Drug (20 - 150 mg/mL) • Vehicle • Water (> 95%) • Surfactants • Preservative • 2 mL vial with 1.2 mL fill
Sterile Suspension Filling Operation On-line Turbidity of Bulk Suspension Recycle Loop Off-line or At-LineNIR Analysisof Filled Vials
Potency vs. Amount Filled • Filling operation is controlled within specifications, but thereis opportunity for improvement near the end of the batch.
At-Line NIR for Suspension Vial Analysis • Foss NIRSystems Model 6500 • Dispersive NIR spectrometer • fiber-optic probe • Spinner - Sample Module • fiber-optic probe • in-house built accessory • Vision® software • Analysis time ~ 1 vial/min • Non-destructive, Non-invasive
Sample Spinner Schematic 45 ° sample needle bearing sleeve holder rotating gear (w = 125 rpm) fiber optic probe mounting bracket
Near-IR Calibration Partial Least Squares Model 2 factors, 1st derivative, 1650-1800 nm
Optek Turbidity Sensor 1. Sensor Body 2. Windows 3. NIR Filter 4. Photo Diode 5. Optics Module 6. Tungsten Lamp
Calibration of On-line Turbidity Sensor • Incrementally dilute a concentrated suspension with known amounts of vehicle. • Correlate calculated suspension potency with turbidity sensor response.
DOE Study using On-line Turbidity Tommy Garner • RFT Black Belt Project to improve Content Uniformity by optimizing filling parameters. • 6 factor DOE study was conducted varying mixing time, mixing power, recirculation flow-rate, etc.
DOE Results • Bottom mixer has minimal contribution to mixing.
DOE Results continued • Mixer power is critical for consistent CU.
Improved Filling Process • Proposed process change: leave mixer on longer. • Three lots demonstrated no dip and no tail at end of fill.
Advantages offered by On-Line Turbidity • Improved temporal sampling resolution. • Cost savings, by reducing or eliminating the need to perform off-line analysis by NIR or HPLC.Note: HPLC analysis by routine labs is ca. $100/analysis. • Eliminated error of taking “grab” samples for off-line analysis. This was found to be significant, if the sampling line is not properly configured, due to settling. • Time savings - ability to perform several parts of the DOE during the same run, i.e., ability to see when system has become perturbed or equilibrated.
Purge Data After startup of filling line following settling of suspension.
Nyquist-Shannon Sampling Theorem The sampling rate must be twice the maximum frequency component of the "signal" being measured, otherwise aliasing will occur. fsampling= 2 fsignal Graphical representations see Aliasing. Bruno A. Olshausen, PCS 129 – Sensory Processes, Oct 10, 2000. http://redwood.ucdavis.edu/bruno/npb261/aliasing.pdf
USP Compendial CU Testing <905> “Uniformity of Dosage Units” in USP-NF • Stage 1 Acceptance CriteriaAssay 10 samples, i.e., n = 10Pass if RSD ≤ 6.0% and no value is outside 85% to 115% claim. Fail if one or more value is outside 75% to 125% claim. • Stage 2 Acceptance CriteriaAssay 20 more samples, i.e., n = 30Pass if RSD ≤ 7.8%, no more than one value is outside 85% to 115% claim, and no value is outside 75% to 125% claim. • Statistics are based on a small sample population;i.e., analytical testing with low statistical power.
CU Testing Criteria for Large N • USP <905> is unsuitable for data sets comprised of large sample populations. • Proposed Acceptance Criteria outlined in article:Sandell D., Vukovinsky K., Diener M., Hofer J., Pazdan J., and Timmermans J. Development of a Content Uniformity Test Suitable for Large Sample Size. Drug Information Journal, Vol 40, pp. 337-344, 2006.
Example #2 – DP Dissolution Monitoring • Objective Provide a non-qualitative means of assessing completion of API dissolution during compounding prior to aseptic filtration. • Quality Impact Assessment Indirect Impact.Current IPC is by monitoring pH. • Key Players Justine McKenzie Project Management Bob Witteman Greenbelt, Manufacturing Engineer Tim Wang Kalamazoo Injectable Manufacturing Bob Leasure Site PAT Support
Solu-Cortef Dissolution Monitoring • Solu-Cortef is a sterile lyophilized parenteral product.The hydrocortisone API is converted to the hemisuccinate sodium salt by addition of base, with care not to exceed the specification of pH 7.8. Excess Base • RDWitteman conducted a RFT Greenbelt study,which concluded that slow response of the on-line pH probe can lead to OOS final pH. • On-line turbidity provides a more sensitive IPC over pH.
Optek Forward Scatter Turbidity Probe Optek Model AS16-N Single Channel Photometer • Forward scatter Turbidity Probe • Operates in NIR from 730 to 970 nm • OPL from 1 to 40 mm • Aseptic Ingold or Triclover fittings • Analog controller, 4-20 mA I/O (no computer) • ca. $10K