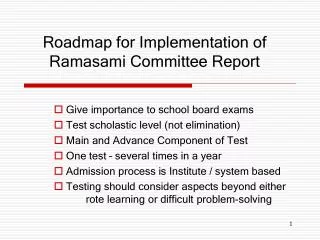
Implementation Roadmap for Lean Implementation
This Lean Implementation Roadmap outlines a structured approach for organizations aiming to enhance their manufacturing processes. The strategy involves common training sessions for cluster members, hand-holding visits to solidify learning, and monthly review meetings for ongoing progress evaluation. Participants, including CEOs and coordinators, engage in extensive training spread over ten months, ensuring knowledge transfer throughout the organization. Key indicators of operational performance, such as product quality and labor productivity, guide the process. Together, these elements foster a culture of continuous improvement.

Implementation Roadmap for Lean Implementation
E N D
Presentation Transcript
Implementation Roadmap for Lean Implementation SuhasGokhale Lean Manufacturing suhasgo@gmail.com Suhas_gokhale@rediffmail.com + 91 9881075056 www.SuhasGokhale.com
CLUSTER METHODOLOGY • INTERVENTIONS are • Common Trainings • Hand Holding Visits • Monthly Review Meetings • Plant Visits
COMMON TRAININGS • Topics of training based on the Roadmap • Common Training for all cluster members • Each Co. to nominate 3 – 4 members • CEO & Coordinator to attend training • Coordinators to train other employees • Training will be spread over 10 months • One hard copy of the training material shall be given to each unit (Co.)
HAND HOLDING VISITS : PURPOSE • To elaborate and customize what has been taught in Training programs. • To help the units to identify improvement projects / activities, in line with what has been taught. • Discuss on the implementing the improvements identified and suggest different options. • Review progress on the work assigned.
HAND HOLDING VISITS : METHOD • The units will be visited by the LMC and the facilitators from OE and Tier I on agreed dates. • The Unit owner and coordinator to be available. • The coordinator of the Unit to record all points of action discussed during the visits and commit target dates.
HAND HOLDING VISITS : METHOD …..contd. • The handholding visits will seek more information about the units for providing appropriate solutions and implementation method. • Transparency and cooperation is needed in sharing the information. • Digital camera is strongly recommended for capturing and analyzing “Before and After” situations.
INTERNAL MRMs • It is very much essential that Unit owner conducts formal internal MRMs before the cluster MRM. • The purpose of internal MRM is to review the progress in a formal way, identify gaps and action plan to fill the gap and record. • It is suggested to have following persons in the internal MRM. The Unit owner, the coordinator, the zone coordinators and team members.
MONTHLY REVIEW MEETINGS • MRM is a monthly meeting of • Unit owner and the coordinators from Cluster member companies • Coordinators and facilitators from OE and Tier I. • LMC or his representative. • Special invitees based on the need • Experts / Industrialists
PURPOSE OF MRM • To share the experience among the Cluster members. • To review the progress and results of the Cluster members. • For conducting the Training programs for Cluster members. • To have direct interaction between all key persons involved in the cluster activities. • To give / receive feedback on implementation. • To share concerns and suggestions.
CONDUCT OF MRMs • Frequency : Monthly • Dates : Last Thursday of every month • Timing : 10 am to 2 pm in conference hall (LEAR / Sharda Motor) 2 pm to 6 pm factory visit (hosting member company) • Coordination : LMC, OE and Tier I • Hosted by : A cluster unit shall host the MRM by rotation
CONDUCT OF MRMs….contd. Requirement of Venue • Should accommodate 30 – 40 persons • A computer, LCD projector, white board, marker, audio arrangements. • Tea / coffee / Lunch / snacks as appropriate
CONDUCT OF MRMs….contd. • The sequence of MRM is on the next page. • The agenda will be finalized and distributed to all concerned by LMC in advance. • Lear to take lead in organizing. • The cluster members MUST come prepared with the presentations in the prescribed formats in SOFT COPY. • The host company to take care of safe & time bound tour of factory and explanations through volunteers. • CD of all presentations shall be compiled at the end of the project for circulation in the cluster.
TYPICALSEQUENCE OF MRMs • ABE Enterprises : 29th Dec’11 • Guru Enterprises : 25th Jan’12 • Jay Industries : 23rdFeb’12 • Raj Industries : 29thMar’12 • Shiv mfg company : 26th Apr’12 • ShriUdyog : 31st May’12 • Star Engine : 28th Jun’12 • YashEngineering : 26th July’12 • Raj Engineering comp : 30th Aug’12 • Ram Fastners : 27th Sept’ 12
SUCCESS OF MRMs It highly depends on • The Unit owner, his coordinators, cluster members attending the MRMs REGULARLY. • Proper and detail presentations (ppt) by the Units. Zone wise achievements, Learning during the month, case studies. • Conducting internal trainings to all employees in the unit by the coordinator. • Conduct and record of internal MRMs.
KEY INDICATORS OF OPERATIONAL PERFORMANCE 7 Primary Indicators • Product Quality • Labour productivity • Stock Turnover (Inventory Turn Ratio – ITR) • Delivery Schedule Achievement • Overall Equipment Effectiveness (OEE) • Floor Space Utilization • Value Added per Personnel Cost (VAPCO)
KEY INDICATORS OF OPERATIONAL PERFORMANCE contd. 14 Secondary Indicators • 5 S scores • SMED Index • Inventory Quality Control (Red, Grey, Green inventory) • Floor Space saving • Safety • Absenteeism • OT hours • Suggestions per employee • Employees Involvement in Improvement activities • Machine breakdown hours • Machine breakdown frequency • Energy Cost Savings • Improvements implemented • Value Added per person (VAP)
1. PRODUCT QUALITY • This indicator measures Product Quality Levels • Expressed in ‘No. of defective parts per million’ • This indicator should decrease over time. • There are three indicators • Customer complaints (No.s) • Customer returns(ppm) • In process Rejection (ppm)
2. LABOUR PRODUCTIVITY • This is a measure of Productivity • This is measured as the ratio between the no. of accepted units made and the total no. of employees hours associated with the mfg. of these units. • It includes Direct, Indirect & Admin staff. • This measure should increase over time.
3. INVENTORY TURNS RATIO • This measures how frequently the stock of raw material, work in process and finished goods are turned over in relation to the material cost in the Sales revenue. • Inventory levels are the key indicators of the ‘Leanness’ of the process and are directly related to the simplicity of production flows. • This increase over time.
3. INVENTORY TURNS RATIO… contd. • Unit Company should define its method of calculation of material cost, inventory compilation. • Unit Company should take a stock of the inventory of RM, WIP, FG on the last day of the month and calculate the ratio. • Include all materials owned, at subcontractors, warehouse etc.
3. INVENTORY TURNS RATIO… contd. Material cost of sales in a particular month ITR = ------------------------------------------- x 12 Inventory of RM + WIP + FG as on date
4. DELIVERY SCHEDULE ACHIEVEMENT • This measures how well a supplier’s dispatches match the planned delivery requirement of the customers. • Unit of this measure is % • This should increase over time. Total no. of dispatches achieved = ------------------------------------------- x 100 Total no. of dispatches planned
5. OVERALL EQUIPMENT EFFECTIVENESS (OEE) • This is a composite measure of the Equipment Performance. • This includes Availability Performance, Operational Performance & Quality performance of the equipment. • This should increase with time. • Unit of measure is % • OEE = Availability Rate x Performance Rate x Quality Rate x 100
6. FLOOR SPACE AREA • This indicator is measured as a ratio of the Sales Revenue generated to the Sq. M of the Unit Co. • It should increase over time. • Unit is Rs./ Sq.M • Considers shop floor, WIP, FG, Tool room, unutilized space for this indicator Sales Value of Production Floor Space Utilization = --------------------------------- Shop floor in Sq.M
7. VALUE ADDED PER PERSONNEL COST (VAPCO) • This is a financial measure that relates the value added with the cost incurred towards the people involved in the value addition process. • Unit for this is Rs. / Rs. • This should increase over time. (Sales value of Production – Variable Cost) VAPCO = --------------------------------------------------------- Total Personnel Cost
SECONDARY INDICATORS These are for improving the Operations • The 5 S Audit cum Score sheet is used to measure 5 S score of the Unit Co. • Unit for this indicator is % • It should increase over time. • It is improved through • 5 S audit • WPP (Worst Point Photography) • FPP (Fixed Point Photography)
SMED Index • This indicator is a measure of flexibility and agility of the shop floor. • The purpose of this indicator is to implement ‘Quick Changeover’ • It should reduce over time. • Make a monthly trend graph for this indicator. • Unit for this indicator is % No. of changeovers in less than 10 min Formula = ----------------------------------------------------- x 100 Total No. of Changeovers
INVENTORY CONTROL(Through Red, Grey, Green tags) • Inventory shall be controlled for RM, WIP, FG • There are three inventory types • Red - Not Required (in this Qtr) • Grey - Not required today (but in Qtr) • Green - Required today (monthly demand) • Actions are suggested based on the type / tag of the inventory
FLOOR SPACE UTILIZATION • This indicator is measured thru the Sq.M of floor space saved thru improvements • It can be office space or shop floor • It should increase over time • Unit is Sq.M • Formula : Space Utilization = Floor Space saved
SAFETY There are two measures for safety • Accident Frequency Rate – No. of accidents occurring in the Co. due to unsafe practices/ conditions. • Prepare monthly chart for it. It should reduce over time. No. of Accidents = ----------------------- X 1 million Total man hours Man hours lost • Accident Severity Rate = --------------------- x 1 million Total man hours avl
Absenteeism & Overtime • This indicator measures the willingness of the employees to come to the workplace and perform value added activities • This indicator should decrease over time. • Unit is % Absenteeism & Rs. for Overtime • Company to prepare trend graph
SUGGESTIONS PER EMPLOYEE • This indicator measures the morale of the employees and readiness to accept the change initiatives within the work environment • Unit is No. / person • This should increase over time Total No. of employee suggestions Formula : ---------------------------------------------- Total no. of employees
MACHINE BREAKDOWN • B’down includes machine stoppage due to • Mechanical faults • Electrical faults • Electronic faults • Unit of this indicator is hours & No.s • It should decrease over time. • Co. should make a monthly trend graph
ENERGY COST SAVINGS • This indicator is a measure of energy input cost reduction in the working of the whole organization. • Unit is Rs. • Energy savings may be Electrical energy, Fuel savings etc. • It should increase over time. • Co. should make a monthly trend graph
IMPROVEMETS IMPLEMENTED • This indicator is a measure of employee participation levels. • Unit is No.s • It should increase over period of time. • Co. should make a monthly trend graph
VALUE ADDED PER PERSON (VAP) • This is a financial measure that relates the value added with the No. of people involved in the value addition process. • Unit is ‘Rs. / Person’ • It should increase over period of time. • Co. should make a monthly trend graph (Sales value of Production – Variable Cost) VAP = -------------------------------------------------------------- Total No. of persons (Direct, Indirect & Admin) Variable cost includes cost of RM, BO, Sub contracted processing, consumables, power, payrolls etc.
Q & A Thank You!