Analysis of TCP Transmission Dynamics Under Loss Probability and Timeout Models
This document explores the dynamics of TCP transmission rates in relation to packet loss probability and timeout scenarios. It presents deterministic and stationary models, highlighting the relationship between congestion window (cwnd), round-trip time (RTT), and data rates. It discusses key metrics such as the maximum drops, total packets sent, and distribution of cwnd modeled as a negative binomial distribution. Additionally, the influence of timeouts on TCP flow rates is examined, providing insights into slow-start models and their impact on network performance.

Analysis of TCP Transmission Dynamics Under Loss Probability and Timeout Models
E N D
Presentation Transcript
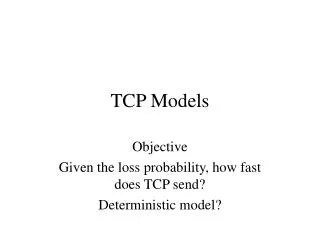
TCP Models Objective Given the loss probability, how fast does TCP send? Deterministic model?
drops wmax cwnd wmax/2 time Wmax/2* RTT Simple Stationary model Data rate = cwnd/RTT Total packet sent=
drops wmax cwnd wmax/2 time Wmax/2* RTT Simple Stationary model
The PDF of the cwnd for a Simplified TCP 0.8 0.7 =1 0.6 The mth moment around the origin scales like -m/2, i.e., 0.5 =0.1 p(cwnd) 0.4 0.3 =0.05 =0.01 0.2 =0.005 0.1 C1 =1.3, C2 = 2.0, C3 = 3.5, C4 = 7.1, … 0 0 5 10 15 20 25 30 cwnd The median scales = 1.2/1/2
Distribution of cwnd Cwnd is nearly distributed according to the negative binomial distribution Gamma function is factorial if argument is an integer Where: c1~sqrt(3/2) E(w²)-E(w)²=(γ/δ) γ≈0.3
5% 10%
Time-out model Rate of going to time-out =
Timeout model If a retransmission is not dropped (only if 1 and 2 didn’t apply). Total rate of entering timeout is: = ’ + ’’
Time-out . Let I₁(t), denote the rate that flows enter timeout at time t
Dynamics of cwnd if proper stochastic calculus is applied, the correct dynamics for the mean are Approximately: SDE gives Using: