Download
1 / 11
110 likes | 170 Vues
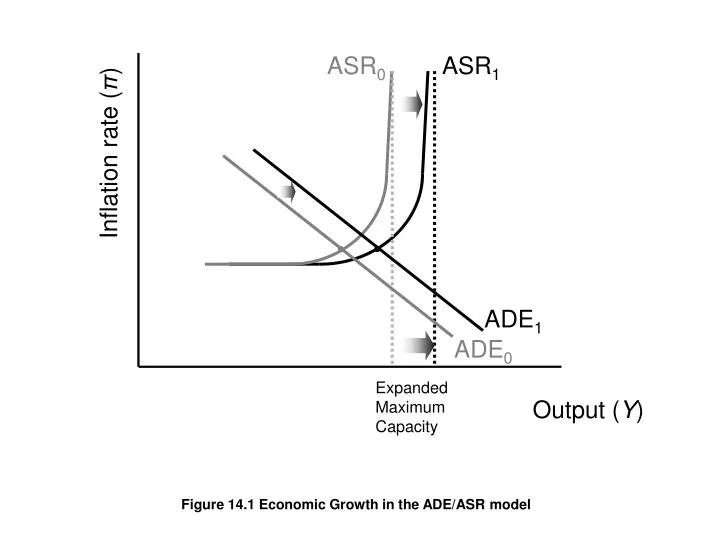
Figure 14.1 Economic Growth in the ADE/ASR model. Figure 14.2 World Economic Growth, 1961-2004. Table 14.1 (Groups Only): Income, Growth, and Population Comparisons, Country Groups. Table 14.1: Income, Growth, and Population Comparisons, Selected Countries and Country Groups

E N D
Table 14.1 (Groups Only): Income, Growth, and Population Comparisons, Country Groups
Table 14.1: Income, Growth, and Population Comparisons, Selected Countries and Country Groups (to be continued…)
(continued) Table 14.1: Income, Growth, and Population Comparisons, Selected Countries and Country Groups
Figure 14.3 GDP per capita in 2004 (in constant 2000 PPP $ per person)
Figure 14.4 The Unequal Distribution of the World’s Income, 2000
Figure 14.5 Per Capita GDP Expressed as a Percentage of Per Capita GDP in High Income Countries
Figure 14.6 The Relation Between Average Annual Growth (1980-2000) and Real GDP Per Capita, with Area Proportional to Population
Figure 14.7 Net Capital Flows to Developing Countries, 1997-2005
Table 14.2 Net Official Development Assistance, 2005, Selected Countries