Download
1 / 28
280 likes | 455 Vues
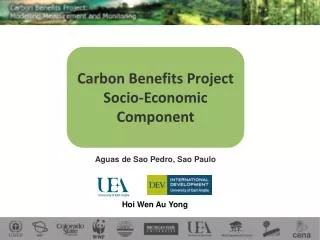
Carbon Benefits Project Socio-Economic Component. Aguas de Sao Pedro, Sao Paulo. Hoi Wen Au Yong. Carbon Benefits Project System. Detailed Assessment. Dynamic Modelling. Simple Assessment. Toolkit advisor. Project Description Module. Guidance Module. Assessment Tools.

E N D
Carbon Benefits ProjectSocio-Economic Component Aguas de Sao Pedro, Sao Paulo Hoi Wen Au Yong
Carbon Benefits Project System Detailed Assessment Dynamic Modelling Simple Assessment Toolkit advisor Project Description Module Guidance Module Assessment Tools Measurement Module Remote Sensing Ground-based Measurement Protocol Module Socioeconomic Tools Project Information Module MRV Module REDD & A/R Carbon Benefits Reporting Module
Purpose of the Socio-economic Component • Capture human-biophysical interactions related to carbon • Understand land user’s socio-economic rationale • Identify trade-offs • Sustainability of carbon benefits
CBP Cost-Benefit Analysis Intro • Shows net benefits of land management practice over time • Assesses if a LMP is financially rational for the land user to implement • Shows profitability of each LMP for comparison • Aids in the decision making process • Aids in the decision-making process on which land use activities are most profitable for land users to implement • Helps to determine the main barriers to carbon friendly practices (such as the initial investment barrier and labour barrier) • Identifies the trade offs that occur as a result of implementing practices that increase carbon benefits • Facilitates judgement on which land management practices to recommend and the support measures needed for uptake to spread
Why Use the CBA Tool? • Answers questions: • What are the economic barriers a land user faces to adopt practices? • high initial investment and labour required? • high risk involved? • How do barriers and profitability of GHG friendly practices compare to that of GHG emitting practices? • What tradeoffs do land users have to make to adopt GHG friendly practices? • What support measures are needed for uptake to spread?
What isa Cost-Benefit Analysis? • Net Benefits of practice
What isa Cost-Benefit Analysis? • Discount Rate Applied • Net benefits accrued in later years of the project are discounted more than the earlier years
Applying the Cost-Benefit Analysis to CBP • Simple Financial CBA • Non-monetary Costs and Benefits not included • - Captured in DPSIR Analysis or CBA Report • From Land User’s Perspective • Duration of 10 Years • All units in per hectare per year
CBA Web Tool Ningxia Worked Example • Project Scenario 1: Ningxia Alfalfa • Project Scenario 2: Ningxia Grapes
Objective of this CBA: To compare which Land Management Practice, growing Alfalfa or Grape, is more financially rational for a landuser to adopt. Perennial Cropland Alfalfa 0 0 500 Grapes -50 100 -100 200
CBA Scenario Graph Interpreting CBA Outputs
Interpreting CBA Outputs Total Ningxia Proj Sc - Alfalfa 155 -880 +871 -1,034 -6.7 +2,890 +11.1 +24,975 +18,458 276% Ningxia Proj Sc - Grapes -13,223 -63.6 +3,516 +33.7 +18,422 +8,948 15% 208 -10,682 0
Interpreting CBA Outputs Interpreting CBA Outputs Break Even Point at Year 1.2
Interpreting CBA Outputs CBA Scenario Graph Break Even Point at Year 6
Interpreting CBA Outputs CBA Summary Graph Net Present Value Over Time
QUESTIONS / COMMENTS? Email: hoiwen.uea@gmail.com
BREAK OUT GROUPS (45mins) • Define Title of Scenario • Fill in CBA Data Template (25mins) - use discount rate of 10% - use exchange rate of 0.57 (BRL to USD) • Enter data into tool ( 10mins) • Interpret Outputs (10mins) • Present Summary Table or Graph (4 X 5mins)