Download
1 / 1
10 likes | 95 Vues
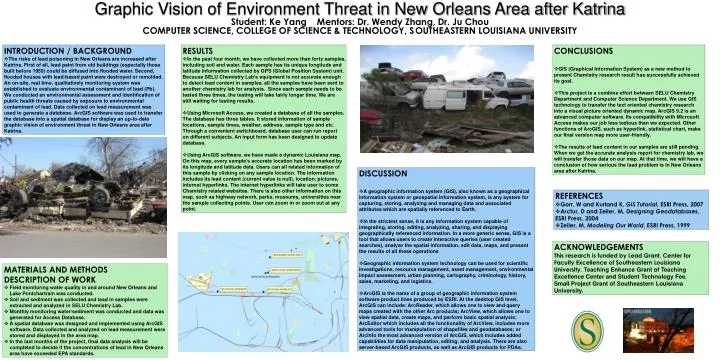
Graphic Vision of Environment Threat in New Orleans Area after Katrina Student: Ke Yang Mentors: Dr. Wendy Zhang, Dr. Ju Chou COMPUTER SCIENCE, COLLEGE OF SCIENCE & TECHNOLOGY, S OUTHEASTERN LOUISIANA UNIVERSITY. INTRODUCTION / BACKGROUND

E N D
Graphic Vision of Environment Threat in New Orleans Area after Katrina Student: Ke Yang Mentors: Dr. Wendy Zhang, Dr. Ju Chou COMPUTER SCIENCE, COLLEGE OF SCIENCE & TECHNOLOGY, S OUTHEASTERN LOUISIANA UNIVERSITY • INTRODUCTION / BACKGROUND • The risks of lead poisoning in New Orleans are increased after Katrina. First of all, lead paint from old buildings (especially those built before 1950) could be diffused into flooded water. Second, flooded houses with lead-based paint were destroyed or remolded. An on-site, real time, qualitatively monitoring system was established to evaluate environmental contaminant of lead (Pb). We conducted an environmental assessment and identification of public health threats caused by exposure to environmental contaminant of lead. Data collected on lead measurement was used to generate a database. ArcGIS software was used to transfer the database into a spatial database for display an up-to-date graphic vision of environment threat in New Orleans area after Katrina. • RESULTS • In the past four month, we have collected more than forty samples, including soil and water. Each sample has its unique longitude and latitude information collected by GPS (Global Position System) unit. Because SELU Chemistry Lab’s equipment is not accurate enough to detect lead content in samples, all the samples have been sent to another chemistry lab for analysis. Since each sample needs to be tested three times, the testing will take fairly longer time. We are still waiting for testing results. • Using Microsoft Access, we created a database of all the samples. The database has three tables. It stored information of sample locations, sample times, weather, address, sample type and etc. Through a convenient switchboard, database user can run report on different subjects. An input form has been designed to update database. • Using ArcGIS software, we have made a dynamic Louisiana map. On this map, every sample’s accurate location has been marked by its longitude and latitude data. Users can all related information of this sample by clicking on any sample location. The information includes its lead content (current value is null), location, pictures, internet hyperlinks. The internet hyperlinks will take user to some Chemistry related websites. There is also other information on this map, such as highway network, parks, museums, universities near the sample collecting points. User can zoom in or zoom out at any point. • CONCLUSIONS • GIS (Graphical Information System) as a new method to present Chemistry research result has successfully achieved its goal. • This project is a combine effort between SELU Chemistry Department and Computer Science Department. We use GIS technology to transfer the text oriented chemistry research into a visual picture oriented dynamic map. ArcGIS 9.2 is an advanced computer software. Its compatibility with Microsoft Access makes our job less tedious than we expected. Other functions of ArcGIS, such as hyperlink, statistical chart, make our final version map more user-friendly. • The results of lead content in our samples are still pending. When we get the accurate analysis report for chemistry lab, we will transfer those data on our map. At that time, we will have a conclusion of how serious the lead problem is in New Orleans area after Katrina. PICTURE • DISCUSSION • A geographic information system (GIS), also known as a geographical information system or geospatial information system, is any system for capturing, storing, analyzing and managing data and associated attributes which are spatially referenced to Earth. • In the strictest sense, it is any information system capable of integrating, storing, editing, analyzing, sharing, and displaying geographically referenced information. In a more generic sense, GIS is a tool that allows users to create interactive queries (user created searches), analyze the spatial information, edit data, maps, and present the results of all these operations • Geographic information system technology can be used for scientific investigations, resource management, asset management, environmental impact assessment, urban planning, cartography, criminology, history, sales, marketing, and logistics. • ArcGIS is the name of a group of geographic information system software product lines produced by ESRI. At the desktop GIS level, ArcGIS can include: ArcReader, which allows one to view and query maps created with the other Arc products; ArcView, which allows one to view spatial data, create maps, and perform basic spatial analysis; ArcEditor which includes all the functionality of ArcView, includes more advanced tools for manipulation of shapefiles and geodatabases; or ArcInfo the most advanced version of ArcGIS, which includes added capabilities for data manipulation, editing, and analysis. There are also server-based ArcGIS products, as well as ArcGIS products for PDAs. • REFERENCES • Gorr, W and Kurland K, GIS Tutorial, ESRI Press, 2007 • Arctur, D and Zeiler, M, Designing Geodatabases, ESRI Press, 2004 • Zeiler, M, Modeling Our World, ESRI Press, 1999 ACKNOWLEDGEMENTS This research is funded by Lead Grant, Center for Faculty Excellence of Southeastern Louisiana University. Teaching Enhance Grant of Teaching Excellence Center and Student Technology Fee. Small Project Grant of Southeastern Louisiana University. • MATERIALS AND METHODS • DESCRIPTION OF WORK • Field monitoring water quality in and around New Orleans and Lake Pontchartrain was conducted. • Soil and sediment was collected and lead in samples were extracted and analyzed in SELU Chemistry Lab. • Monthly monitoring water/sediment was conducted and data was generated for Access Database. • A spatial database was designed and implemented using ArcGIS software. Data collected and analyzed on lead measurement were stored and displayed in the area map. • In the last months of the project, final data analysis will be completed to decide if the concentrations of lead in New Orleans area have exceeded EPA standards.