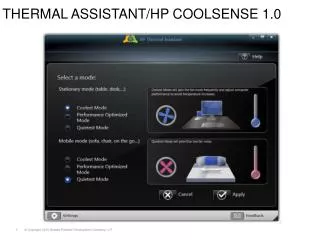
HP Thermal Sensor Grid
HP Thermal Sensor Grid. Mathew Brown HP Cloud Services Global Data Center Operations Jun 13, 2013. Agenda • Introduction • Problem Statement • Rack Sensor Solution • Software Architecture • Using the Data (Visualizations and more) • Measuring Success. Introduction.


HP Thermal Sensor Grid
E N D
Presentation Transcript
HP Thermal Sensor Grid Mathew Brown HP Cloud Services Global Data Center Operations Jun 13, 2013
Agenda • Introduction • Problem Statement • Rack Sensor Solution • Software Architecture • Using the Data (Visualizations and more) • Measuring Success
Introduction Data Centers: HP-IT Global Data Centers • (6) Data Centers & (100) Satellite compute spaces • 400,000+ Sq./ft. • 13,000+ IT racks • 30,000+ servers Core Members: Matt Brown ItoroMeshioyoe Brad Ziemer Erick Levitre Ken Jackson Kevin Smith George Mckee • Organizations: • HP-IT Global Data Center Strategy and Design • HP-IT Cyber Security • HP-IT Global Telecom • HP Cloud Services • HP Labs • End-User Organizations: • Facilities • Data Center IT Operations • Data Center IT Engineering • Enterprise Services • Vendors: • RFCode • Rovisys • OSISoft
Problem Statement • Data Center Engineering was engaged in lots of Data Center energy efficiency projects • Hot Aisle containment • VFD controls • Variable flow floor tiles • Plenum sealing • Temperature adjustments • Etc… • We understood the operational performance and impact to the Mechanical plant, but we realized we didn’t know anything about cooling performance at the IT. • Point measurement solutions were not very useful • Dynamic IT loads were difficult to understand and predict • CFD models were only as good as the quality of input data • We needed a Performance metric for cooling
Technical Objectives • Objectives: • Instrument enough racks in the data center provide an adequate coverage grid to measuring cooling performance • Use Herrlin, M. K., 2005, Rack Cooling Effectiveness in Data Centers & The Green Grids Data Center Maturity Model as a framework for instrumentation • Deliver a hardware abstract solution that meet IT application architecture requirements • Unify data across all data centers into a single database with common role based analytics tools • Standardize one single performance metric for analyzing cooling effectiveness across all data centers
RCI – Rack Cooling Index • The Rack Cooling Index (RCI) • Developed by ANCIS • Magnus K. Herrlin, Ph.D. Formerly, Principal Scientist for Telcordia Technologies • The RCI: a dimensionless index that could become the basis for a common standard • measures how effectively equipment racks are cooled and maintained within industry thermal guidelines and standards • provides the basis for interpreting modeled or measured air intake temperatures
Calculating RCI • The Math Degree Range Tmin rec –Tmin allowable of RCI Low intake temp calculations Degree Range Tmax allowable –Tmax rec of RCI IHI intake temp calculations Number of intake temps Number of intake temps Number of intake temps Number of intake temps Example Excel Formulas =IF(20=0,"",(1-(1/(20*10)))*100) =IF(20=0,"",(1-(42/(20*6)))*100)
Benefits of RCI • Benefits of RCI • Meaningful measure that can also be shown graphically • Easily understood numerical scale - 100% means all racks are cooled to a standard or objective • By using two indices, over-cooling of some racks does not compensate for under-cooling of others • Provides the means to isolate potential heat-related failures • Portable and non-dimensional - it work with any standard or guideline that specifies max/min temperature ranges.
Methodology • Technology Evaluations: • Compared several different sensor & software solutions • Developed TCO cost analysis • Created Test /Dev environment for small scale solution testing / POC • Made sure solution could integrate with existing technologies i.e. EPMS, DCIM solutions • Engaged IT security and Network engineering teams for high level solution design and buy in.
Cost Comparisons • Average cost for a wired solution is ~$500 per rack with cost of associated infrastructure. • Network infrastructure cabling to each rack >~$40K per cell • Three control modules per row for sensors ~$3-5K • Sensors ~$100-250 per sensor • Switches ~$35K per cell • Total per cell >~$200K • Cost of the RF Code solution is ~$250 per rack (4 sensors per rack) minimal infrastructure costs. • Hardware cost is approximately $80K per cell • POE switch $6K per cell • Software/Integration: $14K per cell • Total cost estimate per cell: $100K • Cost of leveraging existing wired Sensors in particular locations <$25K
Solution • Launch a project to deploy 13,000+ sensors across (6) Core IT data centers and (100) compute spaces • Leverage OSIsoft PI system as the data collection and analytics layer • Utilized RFCode 433mhz RF sensors for rack level instrumentation where we didn’t already have legacy wired sensors • Integrated 4000+ pre-existing wired sensors • Hired a systems integrator to build the PI interfaces and visualizations • Project lasted for 9 months • 1900 software development man hours • 7200 install man hours
System Components Cont. RF Code Sensors / Readers • Sensors / Wireless “Tags”: • Simple to deploy • Operate at 433 MHz • Transmit every 10 seconds • Small form factor (2”w * 1.7”d * .3”h) • Long lithium cell battery life (3 to 4 yrs.) • Replaceable battery • CR2302 • Transmit range of 300+ ft. • Installation methods available • Push Pins • Adhesive • Magnetic • Screw
System Components RF Code Reader Layout (Typical) • Readers - are similar in size to a residential wireless router • Security • Tags only transmit data • Readers only receive tag data. • No network entry point via reader. • POE reader every third row on avg. • 3 temp & 1 temp/humidity wireless sensors per rack every 3rd rack • 2 power redundant POE switch connected to the network per cell. • Approx. 12 readers per cell • Approx. 1200 sensors per cell
Challenges Fears around wireless sensors in the DC? • Security • RF Interference • Frequency conflicts (licensing) Ease of Deployment & Maintenance • Zip ties are horrible… • Push pin fasteners are great… • Replacing batteries not great.. • Custom software had to be developed with wired sensor network • Containment areas • Devices that had unique air flow characteristics Environmental • Batteries in the DC • Shhhh…Don’t tell anyone but servers have batteries
What is PI ? HPIT PI System factoids: Single application instance Collects and processes 1.5 million streams of data every min Analyzes over 30,000 data generating devices Annually stores 1.2TB of real-time data 300 different interfaces supporting all major protocols , i.e. Modbus, BACNET, SNMP, OPC etc.. 300,000 concurrent connections The PI System - is a real time “Big Data” historian capable of analyzing and storing millions of data streams • Industries that use PI: • Critical Facilities • Industrial manufacturing • Oil & Gas refineries • Data Centers • Utilities • Power plants
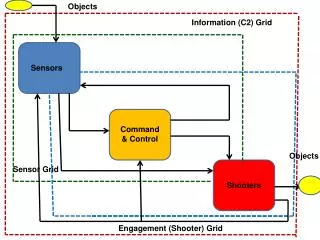
Solution Architecture PI System Components – The software erector set The Visuals: PI Datalink PI ActiveView PI Process Book Mobile PI PI Coresite • The Server: • PI Archive Database (time series) • Asset Frame Work Database • Real-time interfaces The Analytics: Advanced Compute Engine
Transformation of data to information PI System Architecture • Objects represent equipment & processes • PI and non-PI data related to objects • Intuitive search & browse for data • Quick replication of structures • Provides dimensions for BI Data Center Capacity Long-term archival in PI Server PI- Interface Nodes Real-time data collection Energy Trending Real-time energy cost by asset Power Gen & Distribution Building Automation Utility Meter Sensor Network Eco Pod ECS
Solution Architecture Rack Thermal Sensor • Deployed 13,000 + sensors across (6) data centers & 100 remote compute spaces • ~9000 RFCode Sensors • ~4000 Wired Sensors • – RF Code Readers • – RF Code Zone Manager • – OSIsoft PI Interface servers • – PI OPC Interface • - PI RDBMS Interface OPC OPC RDBMS
Visuals - Mobile CELL RCI Rack Temp Row Temps HP Private Cloud - HP Mobile PI Citrix Server hosts visualization – PI ProcessBook – PI ActiveView Rack/Row Based Screen Navigation Real Time Data Trends
Key Performance Indicator RCI High racks that are below 81 F RCI Low racks that are above 65 F RCI Index racks that are within 65 and 81 degrees F RCI The RCI is designed to be a measure of how effectively equipment racks are cooled and maintained within industry thermal guidelines and standards, where 100% means that all racks are cooled within the recommended temperatures RCI RCI
Key Performance Indicator Cooling Improvement Results and Findings: 27% increase in RCI Index across all Data Centers We weren’t as good at the basics as we thought Measuring closer to the IT allows for a more aggressive Energy program Using PI Analytics allows us to identify optimization opportunities Need to incorporate real-time data into other tools i.e. CFD & DCIM application 99% 72% 27% Improvement Estimated Energy Savings 10 million kwh