Download
1 / 40
400 likes | 644 Vues
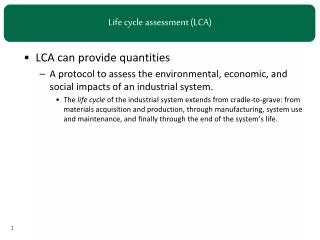
Life Cycle Assessment of biomethane public transport. Jan Paul Lindner Dept. Life Cycle Engineering (GaBi) Chair of Building Physics (LBP) Universität Stuttgart 14 th September 2010, Brussels. Outline. Life Cycle Assessment methodology Product systems Multitude of environmental impacts

E N D
Life Cycle Assessmentof biomethane public transport Jan Paul Lindner Dept. Life Cycle Engineering (GaBi) Chair of Building Physics (LBP) Universität Stuttgart 14th September 2010, Brussels
Outline • Life Cycle Assessment methodology • Product systems • Multitude of environmental impacts • Biomethane from an environmental point of view • Overview • Feedstock generation • Digestion • Upgrading • Distribution • Use
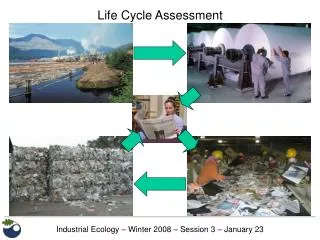
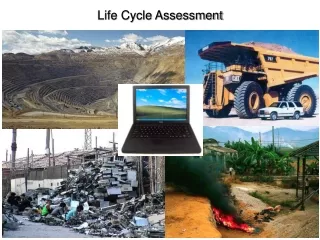
„Cradle to grave“ approach Resource extraction and processing Materials production, product assembly Use phase End-of-life Modular inclusion of other product systems LCA – product systems 4
LCA – product systems CO2 CO CF4 SO2 NOX CH4 HF NOX HCl N2O Climate change, resource consumption, acid rain, summer smog, overfertilisation... Potential impact Impactassessment NH3 PO43– ... NH4+ Life cycleinventory Output Output Output Output Output Input Input Input Input Input Resourceextraction Intermediatesproduction Productassembly Usephase Disposal/recycling Life cycle
LCA – product systems System boundary Process 1 Process 2 Process 3 Output Input Input Output 6
„Environment“ more than just climate Impact categories in Biogasmax Global Warming Potential (GWP100) Eutrophication Potential (EP) Acidification Potential (AP) Photochemical Ozone Creation Potential (POCP) Fossil Primary Energy Demand (PEfossil) Presentation limited to climate impacts Full report coming soon LCA – environmental impacts 8
Biomethane – overview Feedstock Digestion Upgrading Distribution Use Waterscrubbing Waste Truck Chemical absorption Sludge Vehicles Digestion Pipeline Biomass Pressure swing adsorption 9
Environmental impact (climate) GWP [kg CO2equivalent] Feedstock Production Upgrading Distribution Use 10
Environmental impact (climate) Tailpipeemissions GWP [kg CO2equivalent] Life cycleemissions Feedstock Production Upgrading Distribution Use Negative emission? 11
Municipal organic waste Life cycle accounted for in original product system Waste considered “burden free” in biomethane system Sewage sludge Same as municipal waste Dedicated biomass production Feedstock produced exclusively for digestion to biogas Environmental burden of production attributed to biomethane Feedstock generation 12
Environmental impact (climate) GWP [kg CO2equivalent] Feedstock Production Upgrading Distribution Use 13
Environmental impact (climate) GWP [kg CO2equivalent] Feedstock Production Upgrading Distribution Use Biogenic CO2 = part of the natural carbon cycle 14
Environmental impact (climate) GWP [kg CO2equivalent] Feedstock Production Upgrading Distribution Use Biogenic CO2 = part of the natural carbon cycle 15
Environmental impact (climate) GWP [kg CO2equivalent] Release of same amount of CO2 to atmosphere Feedstock Production Upgrading Distribution Use Fixing of CO2 from atmosphere Biogenic CO2 = part of the natural carbon cycle 16
Heat management Dry matter content of slurry defines heat demand Impact depends on type of fuel, combustion conditions Biogas slip from digester Potentially important GWP and POCP contribution Residue valorisation Fertiliser Combustible Filler material Digestion 17
Environmental impact (climate) GWP [kg CO2equivalent] Sludgethickening Feedstock Production Upgrading Distribution Use 18
Environmental impact (climate) GWP [kg CO2equivalent] Feedstock Production Upgrading Distribution Use 19
Environmental impact (climate) GWP [kg CO2equivalent] Methane slip? Feedstock Production Upgrading Distribution Use 20
Environmental impact (climate) GWP [kg CO2equivalent] Feedstock Production Upgrading Distribution Use Residuevalorisation 21
Environmental impact (climate) GWP [kg CO2equivalent] Feedstock Production Upgrading Distribution Use Residuevalorisation 22
Environmental impact (climate) GWP [kg CO2equivalent] Feedstock Production Upgrading Distribution Use 23
District heating Mostly waste heat from industry considered “renewable” Landfill gas Contains ca. 40% methane and lots of impurities Combustion for heat rather than upgrading Landfill emissions allocated based on revenue shares generated from waste disposal and gas sales Digestion 24
Environmental impact (climate) GWP [kg CO2equivalent] Renewable heat source Feedstock Production Upgrading Distribution Use 25
Environmental impact (climate) GWP [kg CO2equivalent] Feedstock Production Upgrading Distribution Use 26
Water scrubbing, PSA Electricity consumption decisive Chemical absorption Heat consumption decisive Methane slip Important GWP and POCP contribution Several mitigation measures exist Conditioning Addition of fossil materials reduces advantage Upgrading 27
Environmental impact (climate) GWP [kg CO2equivalent] Methaneelimination Feedstock Production Upgrading Distribution Use 28
Environmental impact (climate) GWP [kg CO2equivalent] Feedstock Production Upgrading Distribution Use 29
Pipeline transport Little influence on overall result Methane slip potentially important GWP, POCP contribution Truck transport Higher impact than pipeline transportbut no dominant factor in life cycle Filling stations Impact sensitive to power grid mix Methane slip potentially important GWP, POCP contribution Distribution 30
Environmental impact (climate) GWP [kg CO2equivalent] Feedstock Production Upgrading Distribution Use 31
Environmental impact (climate) GWP [kg CO2equivalent] Methane slip? Feedstock Production Upgrading Distribution Use 32
Vehicles Busses Heavy duty vehicles, e.g. garbage trucks Cabs, private cars Use 33
Environmental impact (climate) GWP [kg CO2equivalent] Engine emissions, e.g. NOX, CO Biogenic CO2 Feedstock Production Upgrading Distribution Use 34
Environmental impact (climate) GWP [kg CO2equivalent] Feedstock Production Upgrading Distribution Use 35
Environmental impact (climate) GWP [kg CO2equivalent] Feedstock Production Upgrading Distribution Use 36
Environmental impact (climate) GWP [kg CO2equivalent] Biomethanetotal 37
Environmental impact (climate) GWP [kg CO2equivalent] Biomethanetotal 38
Climate/carbon neutrality of Biomethane Low climate impact, though not 100% climate neutral Considerable improvement potential (technology just stretching into market) Critical points for climate impact Reduction of methane slip at every stage Valorisation of by-products Presentation limited to climate impacts Other impacts may (and do) behave differently Conclusion 39
Contact Dipl.-Ing. Jan Paul Lindner Dept. Life Cycle Engineering (GaBi) Chair of Building Physics (LBP) University of Stuttgart Hauptstr. 113 70771 Echterdingen Germany Tel. +49-711-489999-25 Fax +49-711-489999-11 E-mail jan-paul.lindner@lbp.uni-stuttgart.de