Candlestick Charts
Candlestick Charts. Long Versus Short Bodies. Generally speaking, the longer the body is, the more intense the buying or selling pressure. Conversely, short candlesticks indicate little price movement and represent consolidation. Marubozu Brothers. Even more potent long candlesticks are


Candlestick Charts
E N D
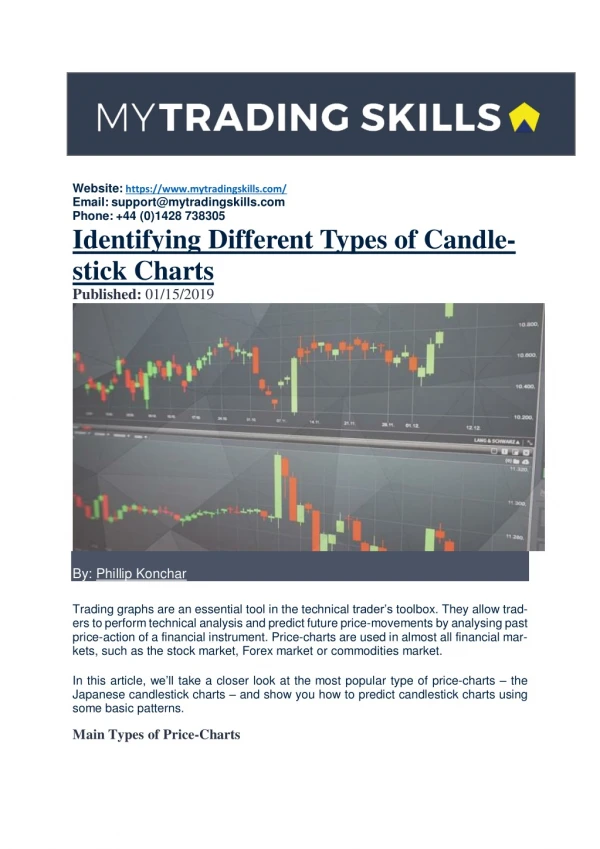
Presentation Transcript
Long Versus Short Bodies Generally speaking, the longer the body is, the more intense the buying or selling pressure. Conversely, short candlesticks indicate little price movement and represent consolidation.
Marubozu Brothers Even more potent long candlesticks are the Marubozu brothers, Black and White. Marubozu do not have upper or lower shadows and the high and low are represented by the open or close. A White Marubozu forms when the open equals the low and the close equals the high. This indicates that buyers controlled the price action from the first trade to the last trade. Black Marubozu form when the open equals the high and the close equals the low. This indicates that sellers controlled the price action from the first trade to the last trade.
Upper & Lower Shadows The upper and lower shadows on candlesticks can provide valuable information about the trading session. Upper shadows represent the session high and lower shadows the session low. Candlesticks with short shadows indicate that most of the trading action was confined near the open and close. Candlestick with long shadows show that trading extended well past the open and close. Candlesticks with a long upper shadow and short lower shadow indicate that buyers dominated during the session, and bid prices higher.
Spinning Tops Candlesticks with a long upper shadow, long lower shadow and small real body are called spinning tops. One long shadow represents a reversal of sorts; spinning tops represent indecision. The small real body (whether hollow or filled) shows little movement from open to close. Even though the session opened and closed with little change, prices moved significantly higher and lower in the meantime.
Doji Doji are important candlesticks that provide information on their own and as components of in a number of important patterns. Doji form when a security's open and close are virtually equal. The length of the upper and lower shadows can vary and the resulting candlestick looks like a cross, inverted cross or plus sign.
What Candlesticks Don't Tell You Candlesticks do not reflect the sequence of events between the open and close, only the relationship between the open and the close. The high and the low are obvious and indisputable, but candlesticks (and bar charts) cannot tell us which came first.