JAPANESE CANDLESTICK PATTERNS
JAPANESE CANDLESTICK PATTERNS. CANDLESTICK SHADOW. The line that appears above and below the body is referred as the SHADOW, WICK or the TAIL Its almost as important as the body It shows us the range for that period It adds to the body’s interpretation of the market psychology

JAPANESE CANDLESTICK PATTERNS
E N D
Presentation Transcript
CANDLESTICK SHADOW • The line that appears above and below the body is referred as the SHADOW, WICK or the TAIL • Its almost as important as the body • It shows us the range for that period • It adds to the body’s interpretation of the market psychology • It represents the high and low for that period • The tail on the top shows us the high for that period • The tail on the bottom shows us the low for that period
CANDLESTICK SHADOW Possible Resistance Possible Support • A long SHADOW can show support or resistance • depending on where it is in the candle and where • It’s located on the charts
BASIC CANDLESTICK PATTERNS • MARUBOZO • SHORT DAY • LONG DAY • SPINNING TOP • DOJI PAPER UMBRELLA
MARUBOZO • Shows large range between the opening and closing price with immediate strength or weakness • Usually the second bar in a reversal or continuation pattern • Has no shadows
SHORT DAYS • Shows small range between the opening and closing price • Small Shadows • Multiple short days can indicate consolidation
LONG DAYS • Shows large range between the opening and closing price • Shows strength and weakness
SPINNING TOPS • The shadows are longer than the body • Shows indecision • Also seen in consolidation
DOJI GRAVESTONE DRAGONFLY LONG-LEGGED FOUR PRICE • The open and close must be equal or very close • Gravestone is BEARISH when at the top of a short term rally • Dragonfly is BULLISH when at the bottom of a short term break • Long-Legged shows INDECISION • Usually seen in illiquid markets, no trades may have took place
GRAVESTONE DOJI SELL BELOW • Gravestones must be seen at the top of a short term uptrend • Buying comes in right from the opening showing continued strength followed by a selloff later in the day, closing near or on the lows • There could be a small wick or very small body • This must be followed by a confirmation bar to confirm trade • Must sell below the lows
DRAGONFLY DOJI BUY ABOVE • Dragonflys must be seen at the bottom of a short term downtrend • Selling comes in right from the opening showing continued weakness followed by a rally later in the day, closing near or on the highs • There could be a small wick or very small body
PAPER UMBRELLA • Color does not matter • Location on the charts is what’s important • They can have small shadows
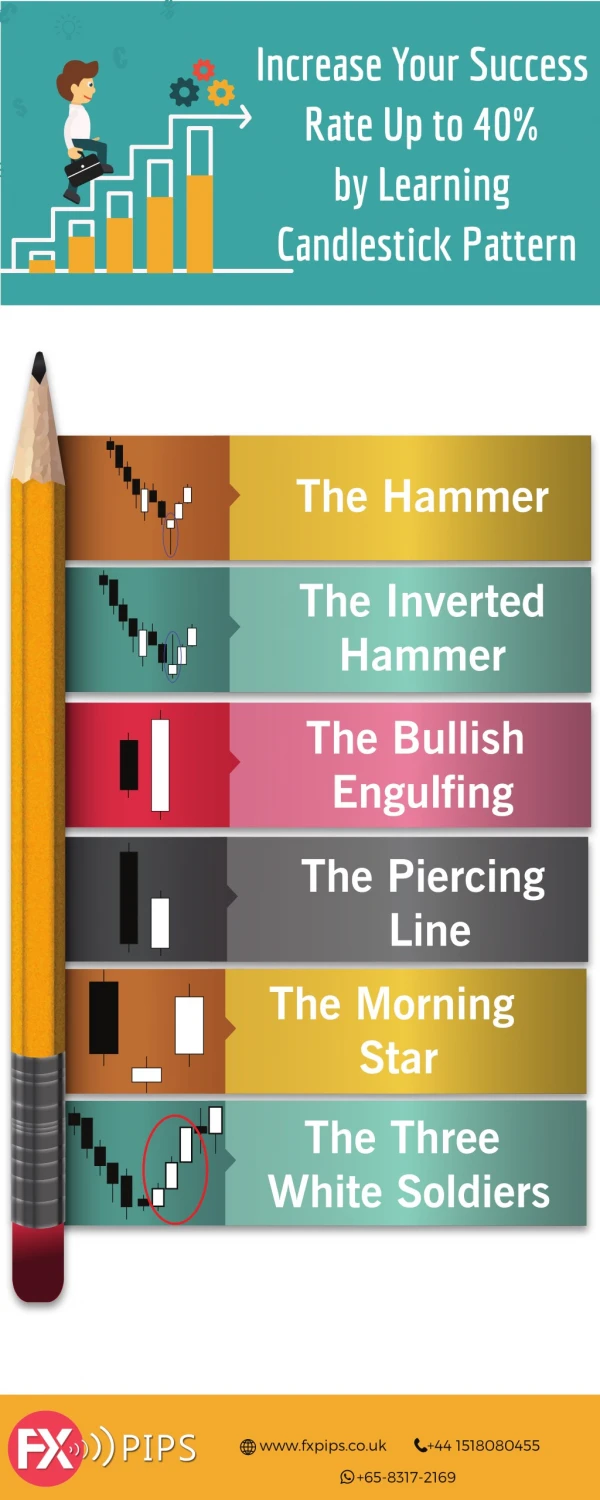
CANDLESTICK REVERSAL PATTERNS • HAMMER • HANGING MAN • INVERTED HAMMER • SHOOTING STAR • ENGULFING • HARAMI • HARAMI CROSS • DOJI STAR • EVENING STAR • MORNING STAR
HAMMER BUY ABOVE • Hammers must be seen at the bottom of a downtrend • Aggressive selling right from the open with a recovery • throughout the day, closing near the highs creates the handle • Color of the body does not matter • Must wait for the next candle to confirm before putting on the trade
HANGING MAN SELL BELOW • The Hanging Man must be seen at the top of an uptrend • Aggressive buying right from the open with a selloff • throughout the day, closing near the highs creates the pattern • Color of the body does not matter • Must wait for the next candle to confirm before putting on the • trade
INVERTED HAMMER BUY ABOVE • Inverted Hammers must be seen at the bottom of a downtrend • Buying comes in right from the opening with a selloff later in the day • Color of the body does not matter
SHOOTING STAR SELL BELOW • Shooting Stars must be seen at the top of an uptrend • Buying comes in right from the opening showing continued strength followed by a selloff later in the day, closing near the lows creating the small body • Color of the body does not matter • Must wait for the next candle to confirm before putting on the • trade
ENGULFING BUY ABOVE SELL BELOW • In an uptrend the open should be higher than previous bars high and in a downtrend the open should be lower than the previous bars low showing a continuation of the trend • The close in should then totally engulf the previous bars high or low to enter the trade
HARAMI SELL BELOW BUY ABOVE • The current candle’s range should be completely engulfed by the previous candle’s body • The colors of the bodies should be reversed for a reversal • The size of the second candle affects the magnitude of the reversal • Must wait for the next candle to confirm before putting on the • trade
HARAMI CROSS SELL BELOW BUY ABOVE • The current candle’s range should be completely engulfed by the previous candle’s body • The size of the second candle affects the magnitude of the reversal • Must wait for the next candle to confirm before putting on the • trade
DOJI STAR BUY ABOVE SELL BELOW • Shows indecision, use overbought/oversold technical indicators when at tops or bottoms of a move • Needs a confirmation candle
MORNING/EVENING DOJI STAR BUY ABOVE SELL BELOW • The star must gap lower at the bottom of a down trend or gap higher at the top of an up trend • Needs a confirmation candle
MORNING/EVENING STAR BUY ABOVE SELL BELOW • The star must gap lower at the bottom of a down trend or gap higher at the top of an up trend • Needs a confirmation candle
ABANDONED BABY BUY ABOVE GAP GAP SELL BELOW • Must have a gap in the direction of the trend followed by a Star or Doji • This must be followed by another gap in the opposite direction
PIERCING LINE BUY ABOVE • Bullish reversal • Continuation of a bearish trend seen by lower open, making new lows, following a long red candle • Closes the day higher than 50% of the previous body
DARK CLOUD COVER SELL BELOW • Bearish reversal • Continuation of a bullish trend seen by higher open, making new highs, following a long green candle • Closes the day lower than 50% of the previous body