Download
1 / 17
200 likes | 278 Vues
Here we go over multiple candlestick patterns and we go over what is different about each pattern and how they are unique.

E N D
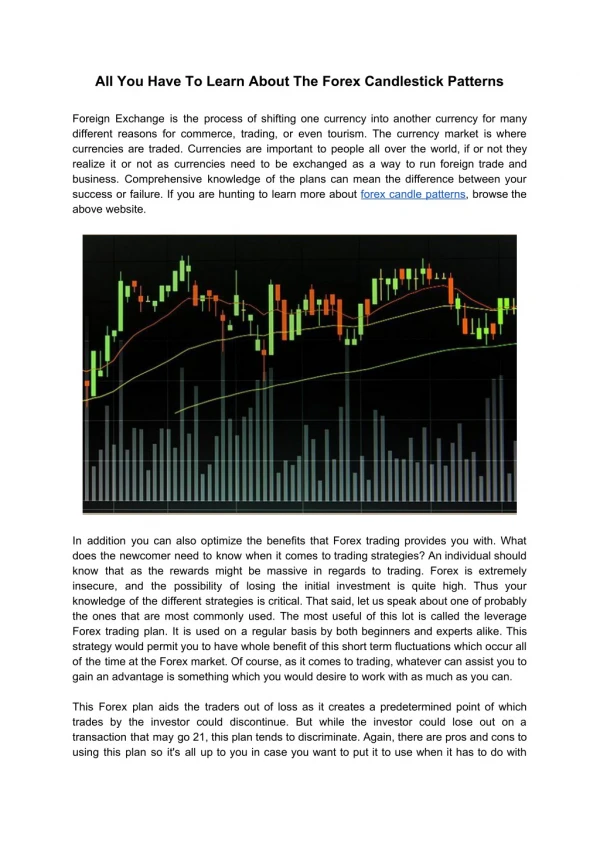
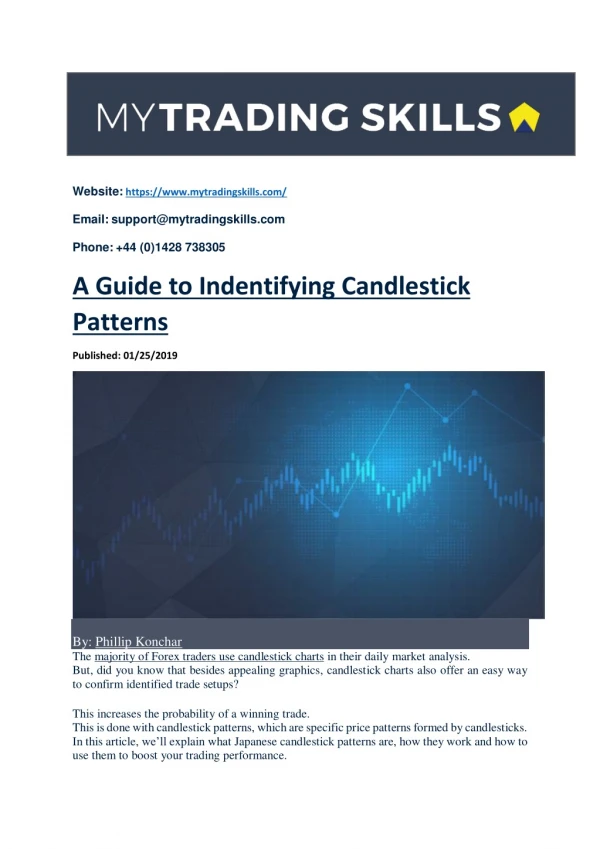
Website:https://www.mytradingskills.com/ Email:support@mytradingskills.com Phone:+44 (0)1428 738305 A Guide to Indentifying Candlestick Patterns Published: 01/25/2019 By: Phillip Konchar The majority of Forex traders use candlestick charts in their daily market analysis. But, did you know that besides appealing graphics, candlestick charts also offer an easy way to confirm identified trade setups? This increases the probability of a winning trade. This is done with candlestick patterns, which are specific price patterns formed by candlesticks. In this article, we’ll explain what Japanese candlestick patterns are, how they work and how to use them to boost your trading performance.
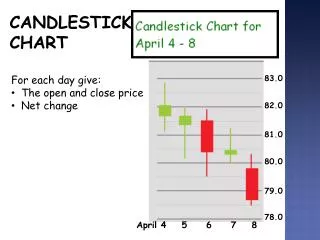
What are Japanese Candlestick Patterns? Japanese candlestick patterns are specific price patterns that are formed by separate candlesticks. Japanese candlestick patterns can even include only a single candlestick, which are then called single candlestick patterns. However, there are also candlestick patterns that include multiple candlesticks, which are somewhat more difficult to spot but offer a great way to gain a feeling of the battle between buyers and sellers in a market. Unlike chart patterns, candlestick patterns focus on single or a group of candlesticks and their open, high, low and close prices. The upper and lower shadows of a candlestick, and the size of its body are of most importance. Did You Know? Candlestick charts were first used by Japanese rice traders in the 18th century. How to Read Japanese Candlestick Patterns? To read Japanese candlestick patterns, a trader has to be familiar with the way a single candlestick forms. The following graphic shows the basic elements of a bullish and bearish candlestick.
Basic Elements of a Bullish and Bearish Candlestick Candlestick charts are also called OHLC charts because they show the open, high, low and close prices of a trading period. The body of a candlestick represents the distance between the opening and closing prices, while the upper and lower wicks reflect the highest and lowest price reached during a trading period, respectively. Looking at a single candlestick, a trader can gain valuable information about the battle between buyers and sellers If the closing price is above the opening price, a bullish candlestick forms. And if the closing price is below the opening price, a bearish candlestick forms. Looking at a single candlestick, a trader can gain valuable information about the battle between buyers and sellers during a trading period. For example, if a candlestick has a long upper shadow, this shows that buyers tried to push the price higher, but sellers managed to withstand the buying pressure and returned the price lower. Similarly, a short body of a candlestick shows that neither buyers nor sellers managed to push the price away from the opening price to a significant extent.
This way, candlestick patterns can be used to anticipate future price movements, analyse the psychology behind market participants, gauge the current market sentiment (bullish, bearish, indecisive), and confirm a trade setup based on other technical tools. Read: The Ins and Outs of Price Action Trading What to Include Your Journal Trading Spreadsheet Top 5 Economic Indicators of the Forex Market Major Japanese Candlestick Patterns In general, Japanese candlestick patterns can be grouped into two categories: Reversal patterns, which signal an upcoming price-reversal, and continuation patterns, which signal an upcoming continuation of the previous price-move. Major reversal and continuation patterns: 1. Engulfing Patterns An engulfing pattern is a Japanese candlestick pattern that includes two candlesticks. It forms with the second candlestick completely engulfing the first candlestick, including its upper and lower shadows. If the previous candlestick is a short bearish candlestick during a downtrend, and the second bullish candlestick completely engulfs the first candlestick, this signals that sellers are losing their power and that buyers are jumping into the market again. Similarly, if the first candlestick is a short bullish candlestick during an uptrend, and the second bearish candlestick completely engulfs the first candlestick, this signals that sellers may have the upper hand again. A bullish and bearish engulfing patterns are shown in the following image. Bullish Engulfing:
Bullish Engulfing Candlestick Bearish Engulfing:
2. Marubozu Patterns Marobozu patterns are major candlestick patterns in the group of continuation patterns. They are single candlestick patterns, which means that they form with a single candlestick. A Marubozu is a very strong bullish or bearish candle, with a long body and without (or with very short) upper and lower wicks. This signals that buying or selling pressure has been extremely strong in the previous trading period, and that the price could continue in the direction of the Marubozu pattern. Bullish and bearish Marubozu patterns are shown in the following image. Bullish Marubozu:
Bullish Marubozo Bearish Marubozu:
Bearish Marubozo 3. Hammer and Hanging Man Patterns Hammer and Hanging Man patterns are single candlestick reversal patterns that form at the bottom of downtrends and the top of uptrends, respectively. They’re characterised by a short body and long lower shadows, signalling that sellers tried to push the price lower but didn’t succeed to close the price far away from the opening price. While the colour of the body isn’t important, a Hammer pattern is slightly more bullish if the body is green, and a Hanging Man pattern is slightly more bearish if the body is red. Hammer Pattern:
Hammer Pattern Hanging Man Pattern:
Hanging Man Pattern 4. Spinning Top/Bottom Pattern A Spinning Top/Bottom pattern is another single candlestick pattern with a short real body, combined with upper and lower shadows at least twice the size of the body. The candlestick signals that both buyers and sellers tried to push the price away from the opening price, only for the price to return close to the opening price. This pattern signals indecision in the market and forms often around important support and resistance levels, at the top of uptrends and the bottom of downtrends. Spinning Bottom Pattern:
Spinning Bottom Pattern If the same pattern forms at the top of an uptrend, it’s called a Spinning Top pattern. 5. Doji Pattern A Doji pattern is a powerful single candlestick pattern in which the opening and closing price are the same. Just like a Spinning Top/Bottom pattern, a Doji pattern signals indecision in the market. It signals that neither buyers nor sellers managed to push the price away from its opening price. A Doji pattern is shown in the following image. Doji Pattern: Doji Pattern
Did You Know? Japanese candlestick patterns are generally grouped into reversal and continuation patterns. Bullish and Bearish Candlestick Patterns While candlestick patterns are generally grouped into reversal and continuation patterns, some traders classify them based on whether they’re bullish or bearish. A reversal pattern that forms at the bottom of a downtrend is basically a bullish pattern, the same as a continuation pattern during an uptrend. On the other side, a reversal pattern that forms at the top of an uptrend and a continuation pattern that forms during downtrends are essentially bearish patterns. Here are a few examples of bullish and bearish candlestick patterns. Examples of Bullish Japanese Candlestick Patterns Three Inside Up Pattern A Three Inside Up Pattern is a bullish candlestick pattern formed by three candlesticks. The first candlestick is a strong bearish candlestick, which is followed by a bullish candlestick that closes below the opening price of the first candlestick. The third candlestick in the pattern is another bullish candlestick that closes well above the first candlestick. This signals that buyers have outperformed sellers and that we can see further strength in the financial instrument. Three Inside Up Pattern
Did You Know? The Three Inside Up pattern is an important reversal pattern which often forms at the bottom of downtrends. Three Soldiers Pattern A Three Soldiers Pattern is a triple candlestick pattern that signals continuation during an uptrend, i.e. it’s a bullish candlestick pattern. For a Three Soldiers Pattern to be valid, we need to have three strong bullish candlesticks (Marubozus), with long real bodies and without (or with very short) upper/lower shadows. Three Soldiers Pattern Examples of Bearish Japanese Candlestick Patterns Three Inside Down Pattern The Three Inside Down pattern is similar to the Three Inside Up pattern. The main difference is this pattern forms at the top of an uptrend and signals an upcoming fall in the price. A Three Inside Down pattern is a triple candlestick pattern, where the first candlestick is a long bullish candlestick, followed by a bearish candlestick that closes above the first candlestick’s low. The third candlestick is again a bearish candlestick that closes below the first candlestick. This signals that sellers are regaining the upper hand in the market.
Three Inside Down Pattern Three Crows Pattern Just like the Three Soldiers pattern, the Three Crows pattern is a continuation pattern with the main difference that it is bearish in nature. It forms with three long bearish candlesticks (Marubozus), without or with very short upper/lower shadows. This pattern signals a strong selling momentum which is likely to continue in the future.
Three Crows Pattern Advanced Japanese Candlestick Patterns: How to Enter a Trade? Now that you know what candlestick patterns are and how to read them, it’s time to explain the most interesting part: How to use candlestick patterns to enter into a trade? While candlestick patterns are a very useful tool, they shouldn’t be used to trade on their own. The formation of a continuation pattern doesn’t necessarily mean that the price will continue in the direction of the previous move. The best way to use candlestick patterns is in combination with other technical tools Similarly, reversal patterns are not always followed by an immediate price reversal. The best way to use candlestick patterns is in combination with other technical tools. They can be a great addition to your trading strategy if you learn how to combine them successfully with other tools to act as a confirmation to enter into a trade. Here are a few examples:
The following image shows a Bullish Pennant chart pattern which triggers a buy signal once the upper resistance line gets broken. As the chart shows, a Bullish Engulfing candlestick pattern has engulfed multiple previous smaller candlesticks, signalling that the price might continue to the upside. This is an example of how to use candlestick patterns to confirm a trade setup based on chart patterns. The following chart shows a Double Bottom reversal chart pattern which triggers a buy signal once the upper resistance line (point 3) gets broken. A trader who is familiar with candlestick patterns will notice the Hanging Man pattern which formed immediately after the breakout. This signals a possible reversal/pullback. Once the pullback finished, a Bullish Engulfing pattern confirmed a buy opportunity and a trader could aim a profit target equal to the height of the Double Bottom pattern. Expert Tip Don’t base your trading decisions only on candlestick patterns. Instead, use them to confirm a trade setup and to increase its probability of success.
Do Japanese Candlestick Patterns Work? Just like other technical tools, Japanese candlestick patterns don’t always work. You’ll need to gain experience in identifying candlestick patterns in order to successfully combine them with your existing trading strategy. Since candlestick patterns reflect the underlying psychology of market participants, the battle between buyers and sellers, they’re an extremely useful tool in price-action trading and can make a real difference to your bottom line if you learn how to use them to confirm a trade setup. Final Words Japanese candlestick patterns are specific price-patterns formed by candlesticks. They provide valuable insight into the dynamics of the market and the battle between buyers and sellers and are often used to confirm a trade setup based on other technical tools. Traders should avoid trading on candlestick patterns alone. Look at the bigger picture and identify important support and resistance levels, chart patterns, trendlines and channels, and use candlestick patterns only to confirm a buy or sell setup. Read: Forex Charting Types Explained Website:https://www.mytradingskills.com/ Email:support@mytradingskills.com Phone:+44 (0)1428 738305