Introduction to Advanced Candlestick Patterns
Introduction to Advanced Candlestick Patterns. Fry Pan Bottom Cradle Pattern Jay-Hook Scoop Pattern Belt Hold Breakout Patterns. Advanced Candlestick Patterns. Fry Pan Bottom. The downtrend starts waning with the appearance of small trading bodies


Introduction to Advanced Candlestick Patterns
E N D
Presentation Transcript
Fry Pan Bottom Cradle Pattern Jay-Hook Scoop Pattern Belt Hold Breakout Patterns Advanced Candlestick Patterns
Fry Pan Bottom • The downtrend starts waning with the appearance of small trading bodies • As the trend starts slowly curling up, a gap up in price indicates that strong buying sentiment has now returned
Fry Pan Bottom Long Rounded Curved bottom
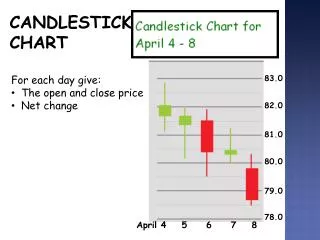
Fry Pan Bottom – minutes, days, months The indecisive rounding bottom is the predominant factor
Fry Pan Bottom - Past Analysis Big Percent move at top has a different meaning when a pattern can be identified
Fry Pan Bottom measuring point A dimple usually marks the Halfway point
Fry Pan Bottom - A Break Out or Failure? Easy identification of a failure, which makes for easy stop loss procedures
Fry Pan Bottom can become a Cup and Handle Handle CUP Or a J-hook pattern
Fry Pan Bottom – Exuberant buying Want to see break out buying
VCI Expected results 55% Gain
FPB/J-hook classic Fry Pan Bottom J-hook
Cradle Pattern • The Cradle Pattern is a symmetric bottom pattern that is easy to identify. • A downtrend becomes obvious with a large black candle at the bottom. • A series of small or indecisive trading days trade in a flat area. • A bullish candle, more powerful with a Bullish Engulfing signal, is formed of approximately the same magnitude as a Bearish candle at the end of the downtrend. • This signifies that the Bulls have come out of the indecisive trading area with decisive force.
Jay Hook Pattern • The first move of the uptrend is very strong. • A candlestick sell signal indicates a pullback about to occur. • After a few days, small indecisive candles start to appear • Doji, small Hammers, Bullish Engulfing signals
Jay Hook Pattern • The first test becomes the recent high • Indecision as found in candlestick sell signals at the recent high becomes a quick indicator to get out of the position • A Bullish candle breaching the recent high illustrates that investor sentiment is taking prices up
Jay Hook Pattern • How to differentiate between profit taking and a full-scale reversal.
J-Hook – How to Identify The pull back is stopped when Candlestick buy signals appear Stochastics do not get to the Oversold area
J-hook - what is first criteria? A strong price trend
J-Hook with added confirmation Indecisive trading at a major moving average Adds more evidence of a J-hook pattern potential
Scoop Pattern • An extended flat trading area • Followed by a pullback • Buy signals bring price back up to flat trading range • Once price breaks above flat range, look for strong uptrend