Download
1 / 12
120 likes | 145 Vues
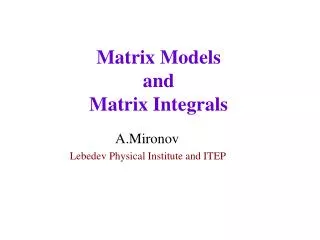
Estimating High Dimensional Covariance Matrix and Volatility Index by making Use of Factor Models. Celine Sun R/Finance 2013. Outline. Introduction Proposed estimation of covariance matrix: Estimator 1: Factor-Model Based Estimator 2: SVD based Empirical testing results

E N D
Estimating High Dimensional Covariance Matrix and Volatility Index by making Use of Factor Models Celine Sun R/Finance 2013
Outline Introduction Proposed estimation of covariance matrix: Estimator 1: Factor-Model Based Estimator 2: SVD based Empirical testing results Proposed volatility estimation: Cross-section volatility (CSV) Empirical Results Conclusion
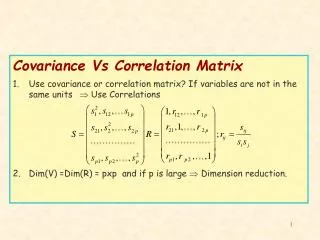
Two new estimators are proposed in this work: We propose two new covariance matrix estimators : Allow non-parametrically time-varying: Estimate the monthly realized covariance matrix using daily data Allow full rank for N>T: Using the factor model and SVD to estimate such that the covariance estimator is full rank The new estimators are different from the commonly used estimators and approaches
Covariance matrix estimation based on FM (factor models) We propose an estimation of covariance matrix, based on a statistical factor model with k factors (k < N). Here, { } are the loadings, { } are the regression errors. Note: The estimator matrix is full rank.
Covariance matrix estimation based on SVD method I propose the 2nd estimation of covariance matrix, based on SVD: Here, { } and { } are from the usual eigen decomposition of the NxN realized variance matrix, and having , with k < N. { } = the remaining terms from reconstructing the return matrix by { } and { }
Empirical testing: 1 Year Rolling Volatility for S&P 500
Empirical testing: 1 Year Rolling Volatility for S&P 500
Volatility Index • A number of drawbacks of current volatility index • Not based on actual stock returns • The index only available to liquid options • Only available at broad market level • Advantage of CSV • Observable at any frequency • Model-free • Available for every region, sector, and style of the equity markets • Don't need to resort option market
Cross-sectional volatility Cross-sectional volatility (CSV) is defined as the standard deviation of a set of asset returns over a period. The relationship between cross-sectional volatility, time-series volatility and average correlation is given by:
Empirical testing: 1 Year Rolling Volatility for S&P 500 Correlation: 0.85
Decomposing Cross-Sectional Volatility Apply the factor model on return The change of beta is more persistent Cross-sectional volatility of the specific return is a proxy for the future volatility The correlation between VIX and CSV of specific return is 0.62.
Conclusion Constructed covariance matrix estimators which are full rank The portfolios constructed based on my estimators have lower volatility Applying factor model structure to CSV gives us a good estimation of the volatility. It could be used at any frequency and at any set of stocks